ESTIMATED STATUS DISTRIBUTION WORLD TAILINGS
There is no existing authoritative (or other) world mine tailings census. WMTF has estimated the size of the world mine tailings portfolio at 29,000-35,000 as of December 2020 based on what authoritative national compilations exist and data on total world mineral production. An accurate account of distribution of the existing world portfolio of tailings facilities by operational and ownership status is critically important to risk assessment and to de risking capital needs in several ways.
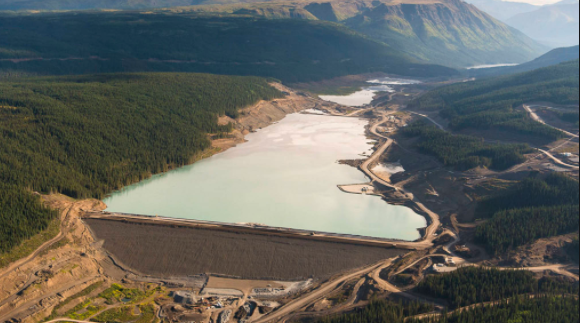
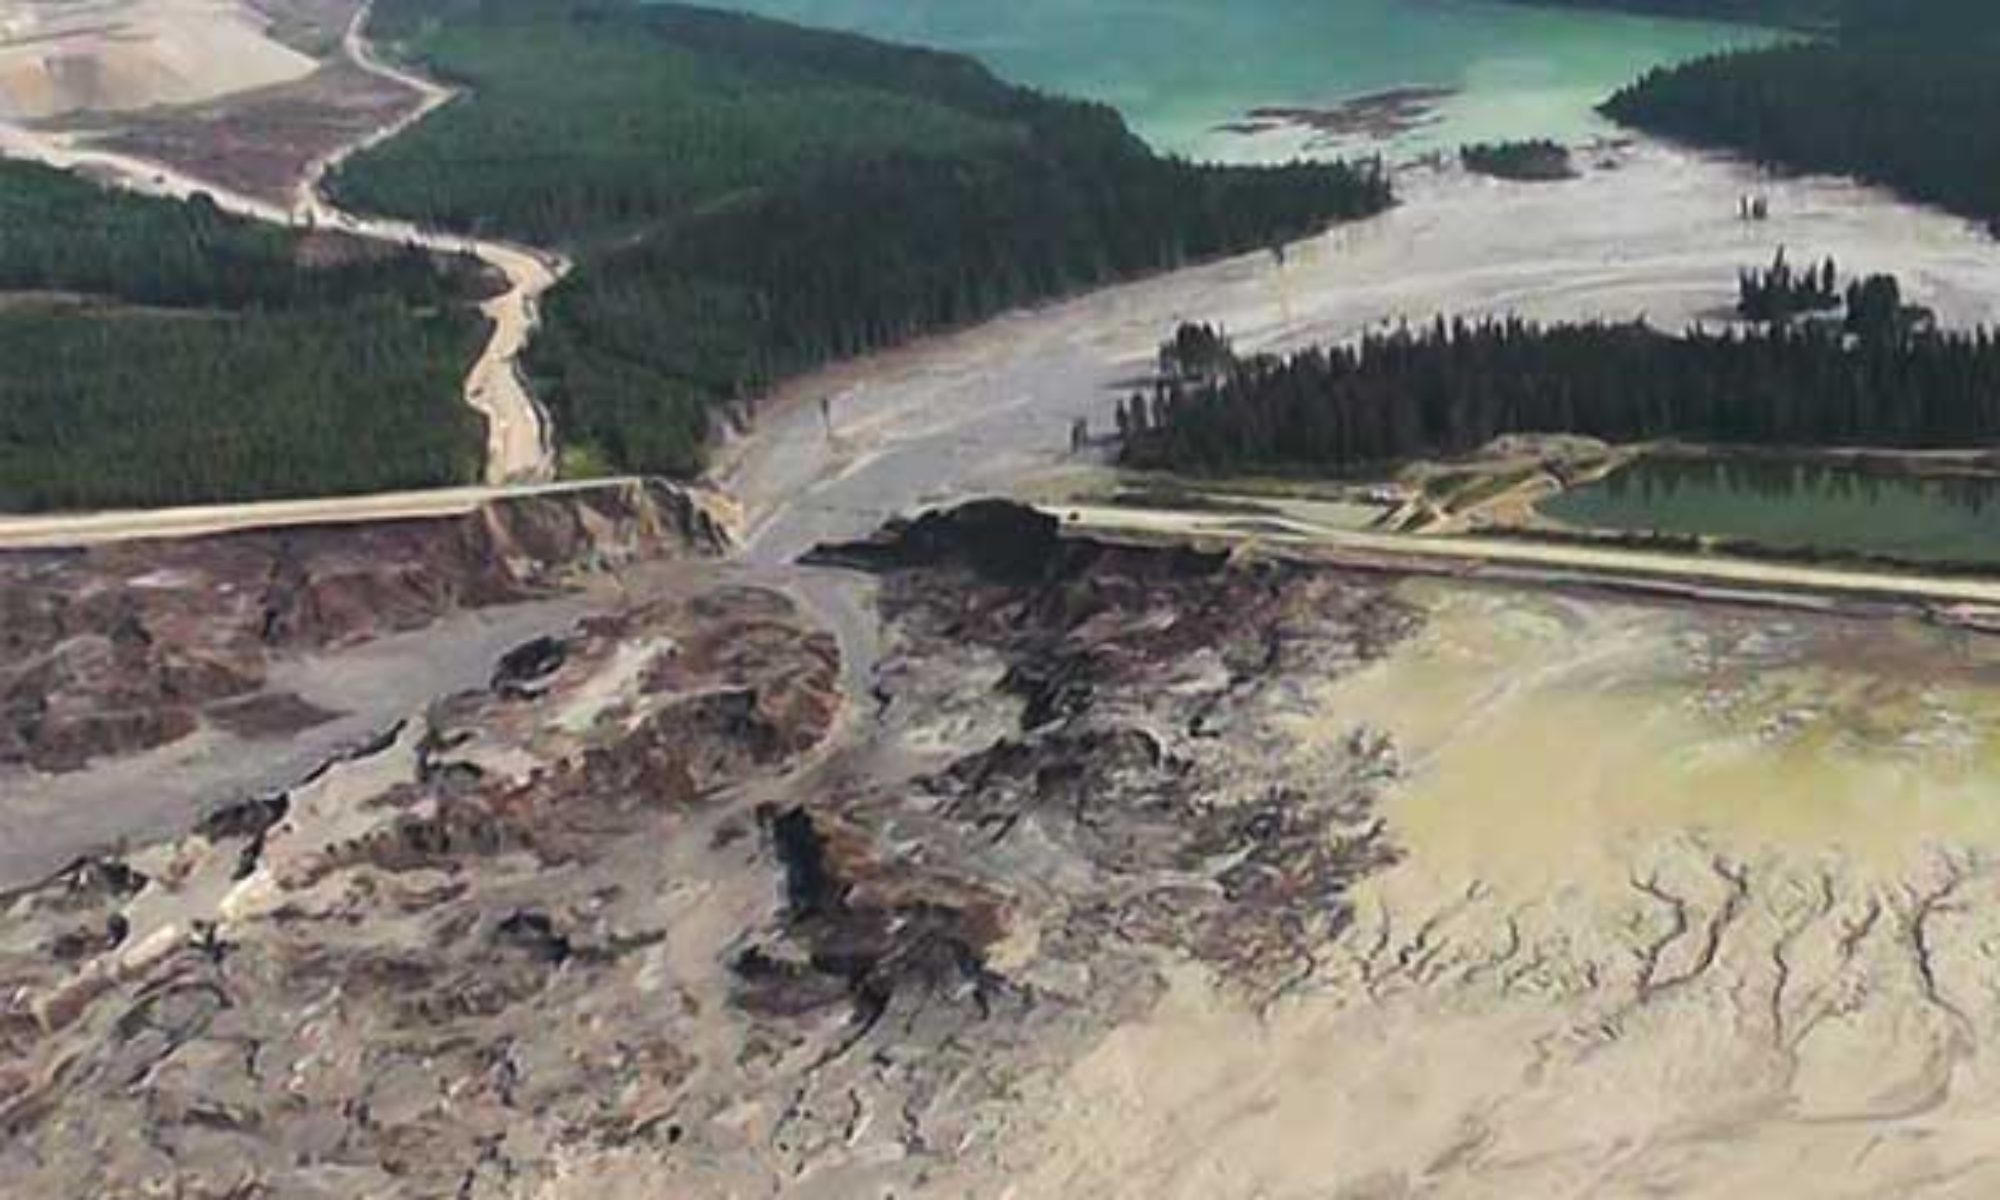
Active indicates the co entanglement of potential risk with current mineral production. As we have seen unfold with Vale’s Brazil portfolio in 2020 an active facility with stability concerns or a significant failure can have major implications for the attainment of production goals. 85% of all catastrophic failures (“very serious in the WMTF severity typology) have been in active facilities. Recent major failures including Samarco, Brumadinho, Mt Polley have stopped all production for a very long time. It is almost never the case that full scale planned operations at active mines can resume quickly os failure. Sometimes, immediate safe short term alternate tailings depositions (e. .g. an old open pit or another inactive facility on site) Even signifuccant unresolved stability concerns can adversely affect operations. 1/3 of all of Vale’s Brazil TSF portfolio have identified stability concerns some affecting planned and promised production. In the case of a dominant world producer in a particular mineral, e.g. Vale’s in iron, any loss of essential tailings capacity that affects production can cause ripples throughout that sector.
Failures and stability concerns that affect production affect revenue where margins are already very tight. Capital must be laid out when revenue is reduced and investor/lender confidence may be impaired to a point where access to credit on favorable terms may also be impaired. The proportion of active to inactive and abandoned indicates the balance between total revenues available from cash flow from producing mine operations to fund any needed de risking of the whole portfolio
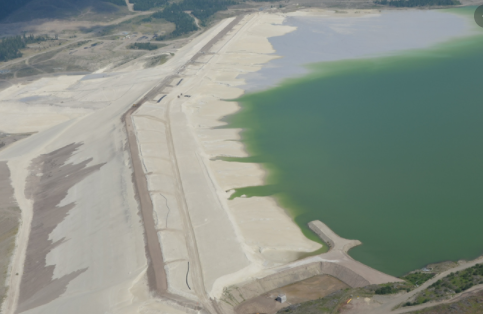
Inactive indicates that portion of the world portfolio currently under control of ownership of active or licensed producers but not presently associated by use with an active revenue stream. It includes TSFs in standby at licensed mine operations with no production, (approximately 1/3 of all licensed operations) (cite dark shadows) and those that are part of the mine site and developed at earlier stages of a still producing mine.
Although only 15% of catastrophic failures in history, as compiled and reported by WMTF, have been at inactive mines, they are not necessarily less prone to failure. Roberto Rodriguez and others have shown that repeated wet dry cycles each wetting cycle is slow to dry and could be building increasing level of total saturation and associated raises in phreatic surface indicating potentially forming and growing liquefaction risk.
Inactive facilities, unless licensing law provides otherwise, are likely to be getting a much lower level of investment, maintenance and stability assessment than the facilities slated to receive ongoing depositions. Although the effects of failure can be generationally devasting to the downstream communities, lands and waters, as at Merriespruit, so long as it doesn’t affect ongoing operations would be of less consequence to the owner operator and to its investors. Therefore, a failure to disclose the number and condition of inactive facilities is a much more serious omission for community of origin than it is for miners and investors.
Abandoned indicates that there is no current mine owner and care, maintenance and closure falls to local Government unless by action of law as in USA superfund structure) past owners are held accountable. Abandoned of course, was not a status in the COE disclosures. There are certainly abandoned structures that could fail but few governments have active loss prevention programs for these facilities even if a failure could have significant community of origin consequence.
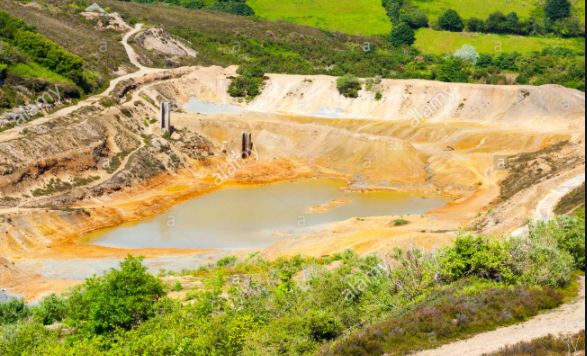
Facilities become abandoned mainly through bankruptcy of the operator, often a shell subsidiary of a larger company or partnership of companies. Only Brazil, to our knowledge has statutory provisions which hold non managing owners jointly and severally liable the operating subsidiary. Only Brazil forbids disposing of a mine with impairments.
We know of no country or permitting jurisdiction that sets aside revenues out of mine related government revenues or which has a Disaster Law with funding provisions.
Data Sets Including Operational Status
WMTF has acquired and cross referenced several data sets each with its own format and most based on and including the Bulletin 121 descriptors (including height, type of construction, year built, release runout and deaths) but not operational status (active, inactive, abandoned) even though it was one of the Bulletin 121 descriptors.
That obviously presents a challenge to creating a solid estimate of active to inactive ratios and counts as important as they are to risk assessment…
Thus a first cut estimate based on the Larrauri world compilation of records with status (573 out of 2791 total record) is that 50% to 60% of the world’s existing ( not closed) TSF’s not currently used for any ongoing depositions are dependent on the profit challenged revenue stream of currently licensed miners in active production. An estimated. 25% of the world portfolio currently has no ongoing care and maintenance, or stability assessment and falls to the Governments who have no provisions for that care or for failure response.
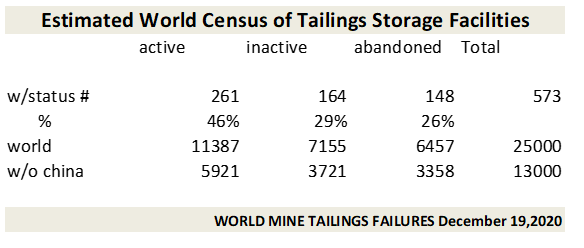
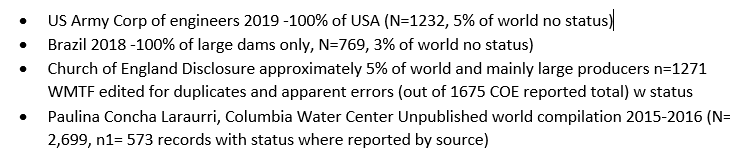
Considering only the count of active and inactive facilities both the COE and the unpublished Laraurri compilation report active as 60% ( COE 673/1271; Laurarri 261/425)
The absence of an adequate accounting of all TSF’s licensed and not yet closed by the governments issuing permits and charged with oversight is a serious failure of due diligence and obligation to investors and to communities of origin. The omission of data points on operational status, a descriptor considered essential even by the minimum standards of Bulletin 121 further reduces the value of those disclosures for risk assessment and calculation of capital shortfalls on de risking finance needs.
We welcome all contributions and corrections with documentation especially on the status of tailings facilities which are in national disclapusres but do nt presently include status.
Please submit any corrections or additions to Lindsay Newland Bowker compiler@worldminetaiingsfailures.org
We welcome your financial support as well for continued development work on a meaningful risk focused global assessment of the World Tailings Portflio. Our budget 2021 2023 for furter development of data on operating status withn existng national disaclosures is $60,000 and you may ear mark your USA tax deductible contribution to this project by check payable to World Mine Tailings Failures. Mailing address John Z.Steed,Esq., Treasurer, World Mine Tailings Failures 36 Main Street PO Box 368 Blue Hill,Maine04614.. or by wire transfer contact jsteed@ellenbestlaw.com. Our US non proft id is 833883531. We are chartered in the State of Maine. The code for this project is RSKOPSTAT.
WMTF PROJECT SUMMARY RSKOPSTAT
The funds will be used mainly to develop ststaus information on as many tailings facilities as possible presently listed in national tailings disclosures 2025 or later.The aim is to develop and analyze more actuarially useful opertaional status data on as many complete miner or national portoios as possible so as to have a firmer estimate of world distribution. It is a tedious labor intensive task requiring google searches on 2,200 facilities in the Laraurri compilation whih did not include this data.
Of course if there are new disclsures whh include thse data, we woud appreciate having them forwaded to us to expand the Laraurri base data set.
We are also happy to do presentations to your organization. As a presenter in the context of your organized and managed webinar our minimum honorarium is $1,000 for a 5-10 minute presentaion including a power point with 10 minutes of Q&A. contact Lindsay Newland Bowker compiler@worldminetailingsfailures.org to discuss. Payment , as above.