STATE OF WORLD MINE TAILINGS PORTFOLIO 2020
INCREASING RISK & FAILURE SEVERITY FOR COMMUNITIES & INVESTORS WITHOUT MAJOR SUPPLY SIDE REFORMS NOT DELIVERED BY AS ANNOUNCED GTR, NGO OR GOVERNMENT INITIATIVES
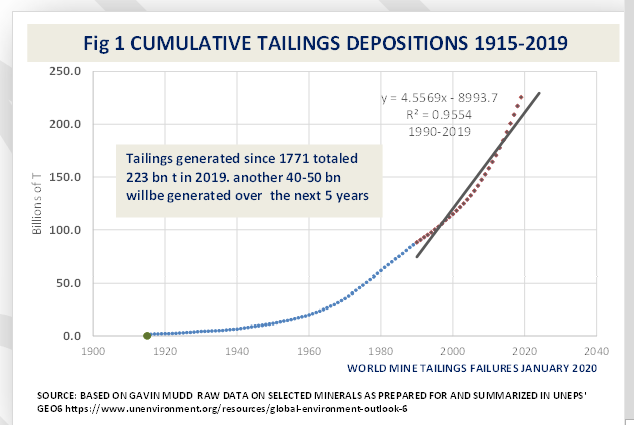
The world’s 29,000-35,000 {1} existing active, inactive and abandoned tailings storage facilities (TSF) contain approximately 223 billion tonnes (534 billion cubic meters) {2} Fig1 .
Annually, to produce the world’s 18-20 billion tonnes {3] of minerals requires the generation of 80-90 bn tonnes of waste rock and 8 billion tonnes (19 bn m3) of tailings. [4]
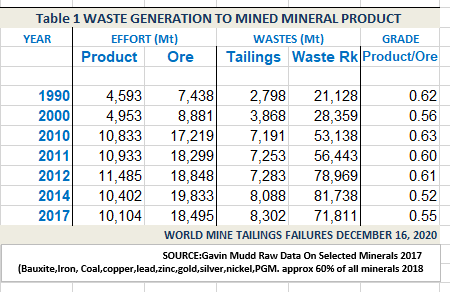
Presently, every one million tonnes of mined mineral product generated requires physical and economic provision to also manage 4.9 million tonnes of waste ore, waste rock and tailings. (Fig 2 and Table 1)
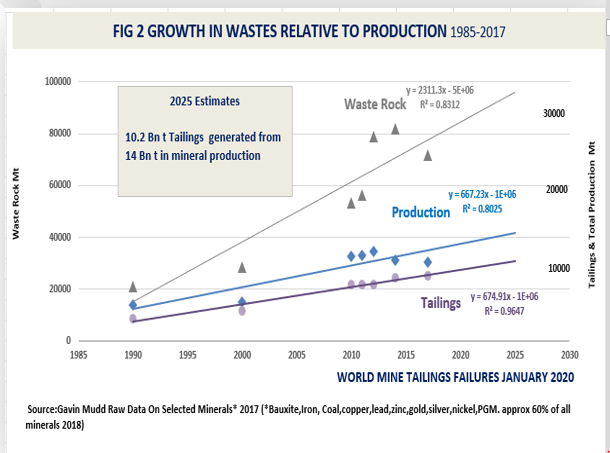
The increasing volumes of total waste to product is directly attributable to the mining of ever lower grades across all minerals.
TREND IS OF INCREASING FREQUENCY AND SEVERITY OF FAILURES
The present average size for a TSF is 17 million cubic meters. Only 11 (9%) of 118 post 1950 serious and very serious failures in the World Mine Tailings Failures database have a recorded capacity of that size or greater Indicating that future “Very Serious” and “Serious” failures will be of much greater magnitude.
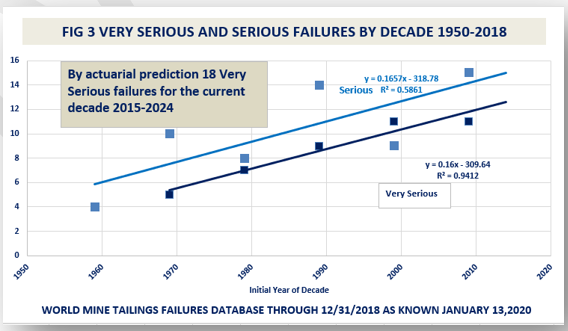
A continuation of present supply side conditions and trends will result in 18 {5} catastrophic tailings failures for the decade 2015 to 2024 (Fig 3). Nine “very serious” and 5 “serious” failures have already occurred.
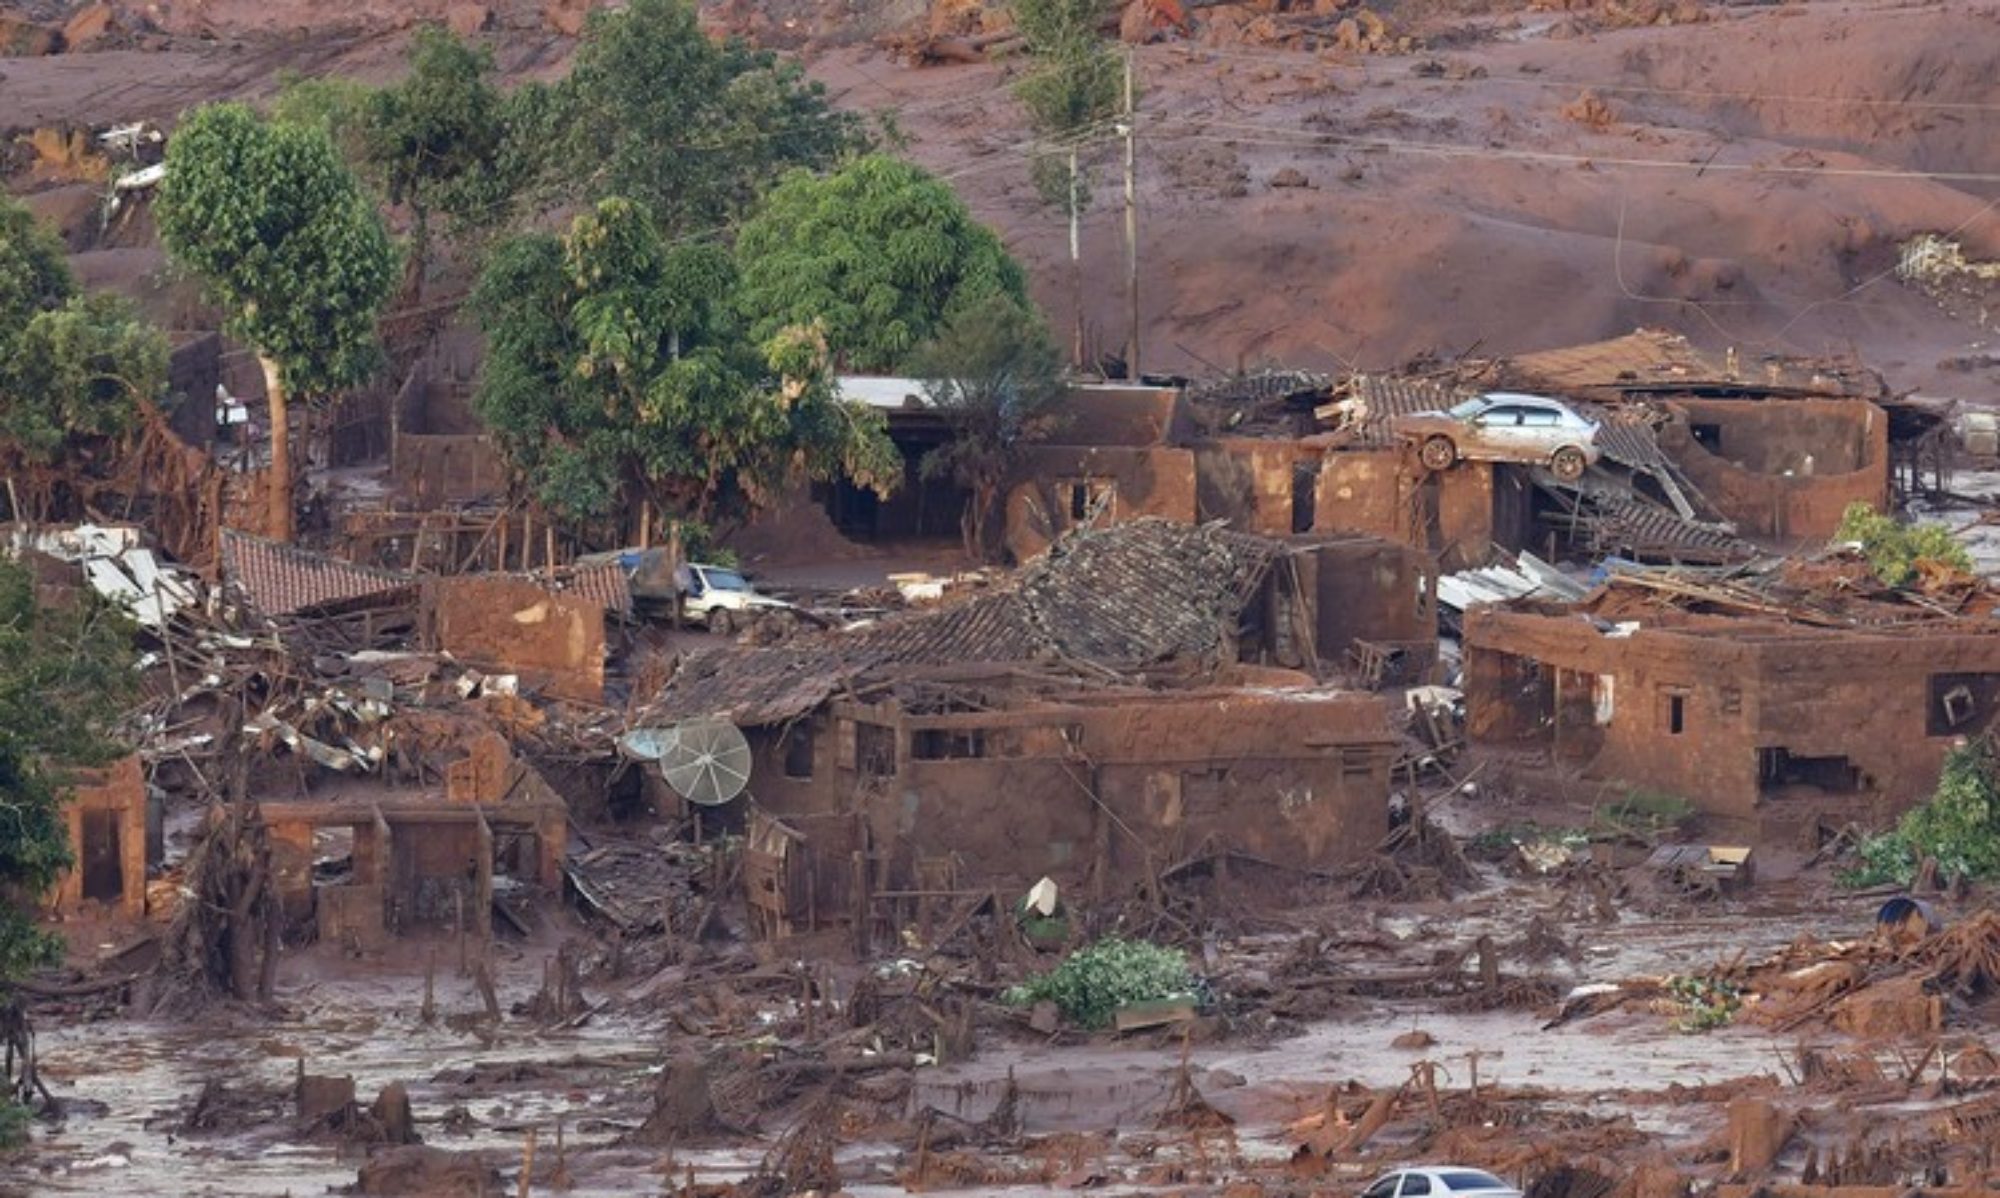
Although Brumadinho awakened a very big response in all stakeholder sectors, the Global Tailings Review(GTR), the NGO response, Safety First and what has emerged in individual organizations in all stakeholder sectors, will not alter failure trends nor prevent the already very advanced failure conditions in those 18 facilities worldwide that will have catastrophic failures this decade (2015-2024) Fig 3 . The joint and several effect of all these initiatives will not substantially alter risk in the present world portfolio.
We can expect the magnitude of the predicted 18 failures 2015-2024 to be far greater than even the worst of what we have already experienced for three main reasons.(1) because existing TSF’s are being stretched beyond original design to receive more and more tailings; (2) because so many of the TSF’s that are slated to receive the tailings from the next 5 years of planned mineral production are old,” high hazard potential ” TSFs without a life of facility management within what we now understand to be best practice and without a rigorous independent stability analysis and (3) because the industry’s determined push to lower grades will escalate the volume of wet load and stress with materials more susceptible to static failure ( collapse by flow slide generated by stresses within the tailings stack itself).
Over the next 5 years the industry will generate another 40-50 bn tonnes of tailings (95-120 bn cubic meters). Almost all of this will be in conventional slurry to conventional and already existing above ground TSF’s an estimated 50%-65% of which were built before 1990 when the framework of guidance on still applicable Best Practices” had been laid down but not embraced in prevailing practice. The total world volume of tailings as of 2025 will become 640 billion cubic meters.[6]
RISK CONCENTRATED IN ACTIVE FACILITIES
This additional 95-120 bn cubic meters of tailings will be stored in an estimated 16,000 currently active TSFs. Each active TSF will receive an average of 6 M cubic meters on top of the 17M cubic meters of existing depositions. Overall, the data suggests a projected 35% increase in size of each active facility, an increase of about about 7% per year.
Historically 85% of catastrophic failures (“very serious in the WMTF severity typology) arose from active TSFs.
For further analysis of the risks associated with operational status distribution within in any given portfolio please visit our webpage on the risk implications of operational status distribution worldwide and in any given portfolio.
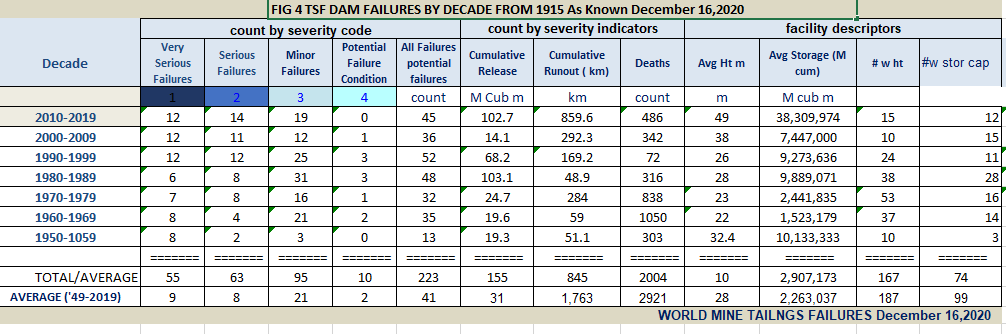
The increasing frequency and severity of significant failures is apparent in Fig 4. Release, runout and deaths are all dramatically higher 2010-2019 than 2000-2009.
Based on available compilations which include hazard potential (7) an apparent 43-50% of all existing tailings are in “high hazard potential” TSFs and that percentage is not expected to change over the next 5 years with over 90% of all new depositions going to already existing standard above ground storage facilities.(8)
Our mineral supply side model is pushing unnecessarily into ever lower ore grades (9) at existing mines with flow sheets in need of major reforms in productivity, efficiency and modernization (9). That combination will result in a significantly elevated civil and investor risk profile by 2025 if no supply side reforms accompany the tailings design and management reforms urged by the Global Tailings Review. Tailings reforms alone will not lower risk and consequence of catastrophic tailings failures. It is imperative to also de risk existing TSF’s, especially those slated to receive planned mineral production and to simultaneously overhaul flowsheets to improve efficiency and productivity,
That will require building a comprehensive, funded, competently managed worldwide facility for de risking the existing world tailings portfolio. Many vulnerable facilities were either dumped by the majors or developed by, and still in in the hands of, marginally financed mine owners at sub economic already permitted mines. Others, sometimes referred to as legacy mines, came with the deals made in mergers and acquisitions, the major strategy by which the majors became the majors.
A currently producing mine may have several no longer used, not useable and not yet closed TSF’s. The revenue from currently producing mines, especially in low mineral production growth regions like Europe and North America, cannot in many instances even pay for the needed reformation/de risking of the facilities scheduled to receive wastes these next 5 years let alone pay for de risking or closing of other TSF’s and waste piles on site.
The math is simple. We can’t expect to finance the correction of existing problems in 543 billion cubic meters of tailings from the revenues of production of 45 bn cubic meters in new mineral product per year. The present world portfolio of 29,000-35,000 TSFs accumulated its present risk through 6 decades of gaps in permitting and regulatory oversight and on qualifications and history of the miner, meaningful standards for proof of economic viability of the enterprise, clear standards for waste management and the omission of requirements to evidence attainability within the limits of existing proven technology.
Of course, all of these standards must be incorporated into governance. But building these standards into statutes or only into stated company policy cannot attain a safe worldwide tailings portfolio unless we concurrently can finance attainment of those standards not just in new TSF’s but in all risk incubating already licensed and abandoned TSFs. It can’t be financed out of current revenues. It can’t be attained without a robust, competently staffed plan and program which does not currently exist.
We are not suggesting that noneconomic ventures in the hands of poorly capitalized miners should be “rescued” or in any way facilitated or even continued. We are suggesting however, that all facilities posing a real threat of failure and which have a high hazard potential should be prioritized for evaluation and correction regardless of the present owner’s ability to pay for those interventions out of revenue and regardless of the mine’s viability for continued production.
In our invited presentation to The Church of England Pension Funds in February 2019 we drew an analogy between the risk in the present world portfolio of tailings and the everywhere present risk we allowed to form with asbestos and lead based paint. When we discovered that these elements, long valued for their specific performance attributes, posed serious health risks it was clear that forbidding continued use would not alone reduce the risk. These everywhere present materials needed to be not just discontinued but removed or encapsulated to prevent further harm. Easier said than done when federal laws and regulations were finally passed. Harder still for mining.
With lead and asbestos the costs of removal and safe management fell to the millions of owners of buildings and structures containing those risk. Each owner was a “polluter” in the polluter pays” mandate of mining. In mining a very small number of companies are the “owners” on whom the entire financial burden falls for a cost that is huge in relation to revenue and current profits. It’s more like when a roof fails or an engine repair light comes on. Most owners need to stretch the cost out over time.
We can’t change what is already generated in wastes but we can commit to de risking or removing all tailings facilities that pose a high threat of harm in the event of failure and for which no re-configuration is possible. We can implement a risk-centered standard for every TSF slated to receive the 40 to 50 bn t of tailings which will be generated over the next 5 years. We can begin to reevaluate the viability and desirability of higher standards at already permitted and in approval mines and mine projects.
{1} Bowker Associates Science & Research In The Public Interest mainly from an attempted Global Census of Large Dams 2016. Details and sources are presented in the Technical Appendix . Sources are mainly authoritative cites or actual national or regional totals.
{2} Based on an estimate of global copper production and associated tailings volumes 1770-2017 developed by Gavin Mudd and presented in UNEP’s 2019 GEO 6. As further documented in the technical appendix, Mudd’s CU data totaled 92.5 bn in cumulative tailings generated as of 2015. Our estimate of world mineral tails projects from that based cu tailings as a % world minerals tailings from the Mudd Mineral Wastes Survey cited in Table 1 and Figure 1. We have no historical data on disposal and storage of these “ever generated wastes”. Some in early days may have just been dumped on land without engineered containment. Some may have just been dumped in lakes, rivers or the sea. We have no way to estimate what fraction was not disposed above ground so for purposes of this report we are treating all tailings ever generated as deposited to above ground facilities, engineered or not.
[3) Based on data for 1986, 2000, and 2016 presented by WMD 2018 and projected forward from the average annual growth 2000 to 2016 (an annual increase of .03291/per year)
{4} Mudd waste survey on selected minerals representing about 60% of total world mineral production
[5] projected from trend lines on cited WMD2018 and Mudd data and partly informed by the COE disclosures which specifically report planned depositions next 5 years.
{6} See Technical Documentation on predictive method Bowker Chamber 2015 based on actuarial methods for property & casualty insurance.
{6} We have used 6 compilations for this report; that part of the Chuch of England disclosures which was immediately useable, the 2019 national disclosures for Brazil and the USA, 2015 and 2016 Chilean disclosures and a 2016 compilation by the Columbia Water Center.
{7} Partly informed by COE disclosures but also from many compilations on year TSF built.
{8} Gavin Mudd world waste survey for the joint study groups and Geo6
[9] David Humphreys many works on the challenge of the transition to sutainable mining especially .
https://ideas.repec.org/a/spr/minecn/v32y2019i2d10.1007_s13563-018-0155-x.html
David Humphreys, 2019. “The mining industry after the boom,” Mineral Economics, Springer;Raw Materials Group (RMG);Luleå University of Technology, vol. 32(2), pages 145-151, July.https://link.springer.com/article/10.1007/s13563-019-00172-9
Mining productivity and the fourth industrial revolution David Humphreys Mineral Economics volume 33, pages115–125(2020)