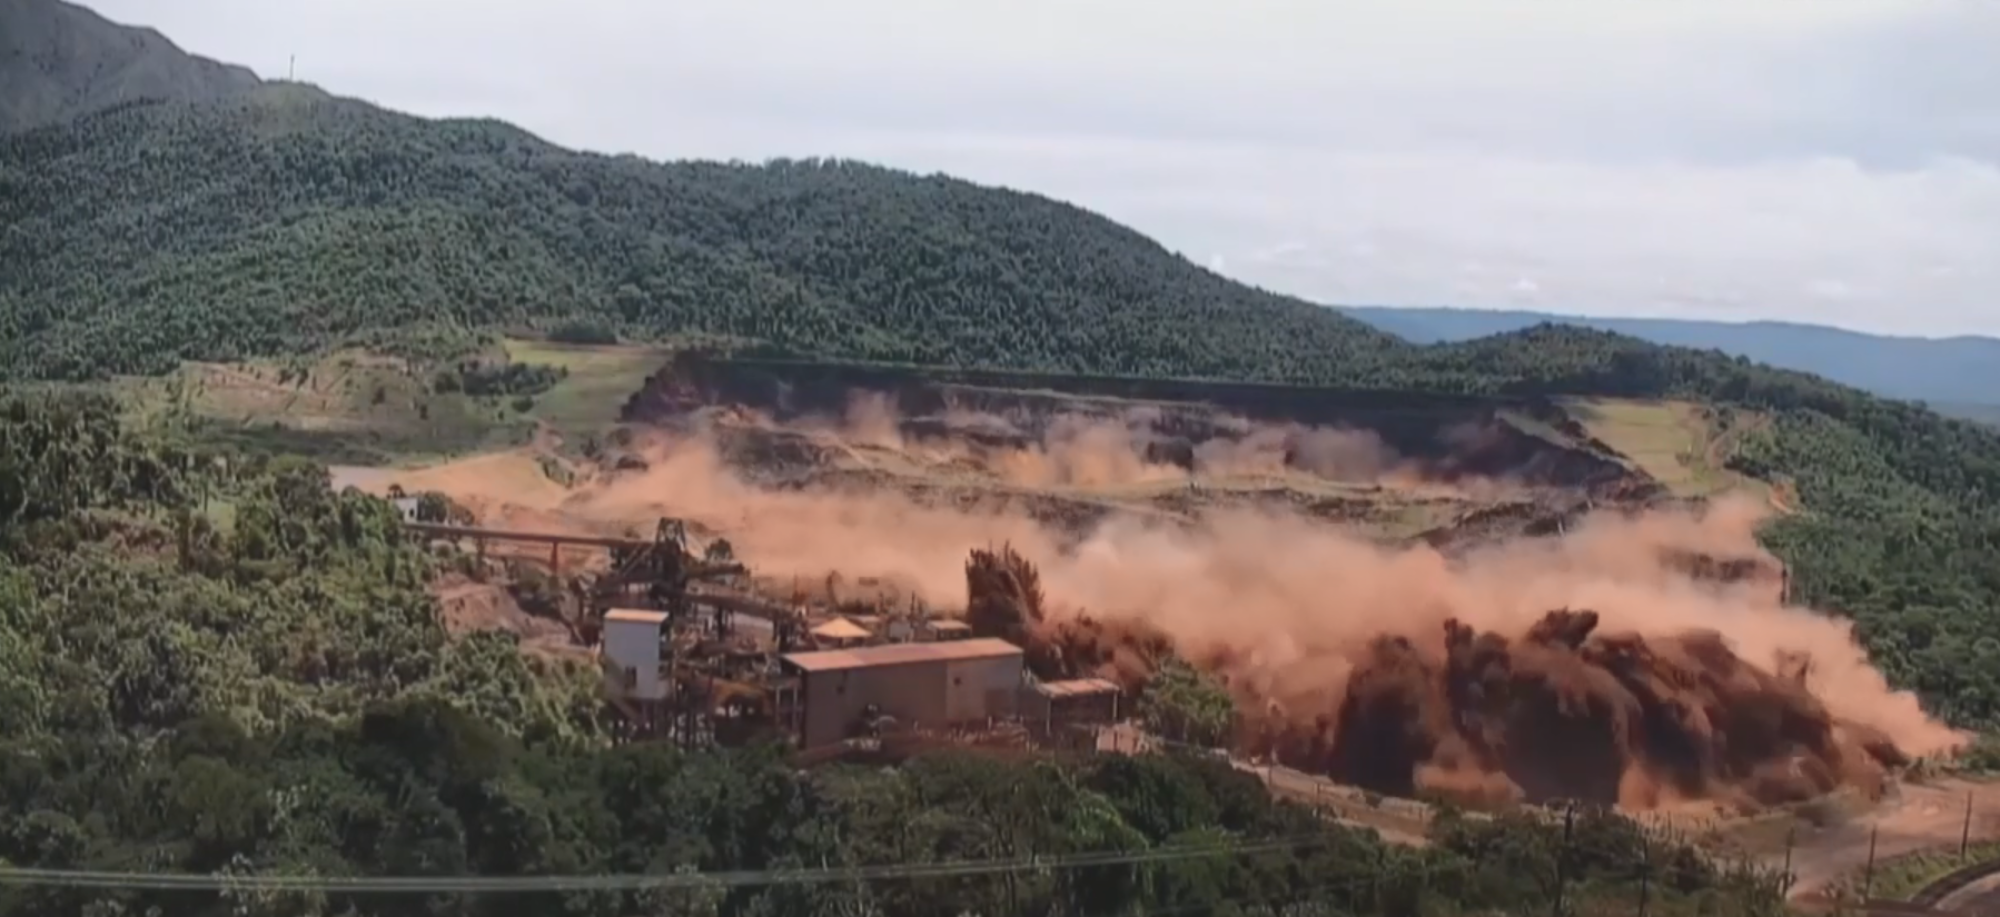
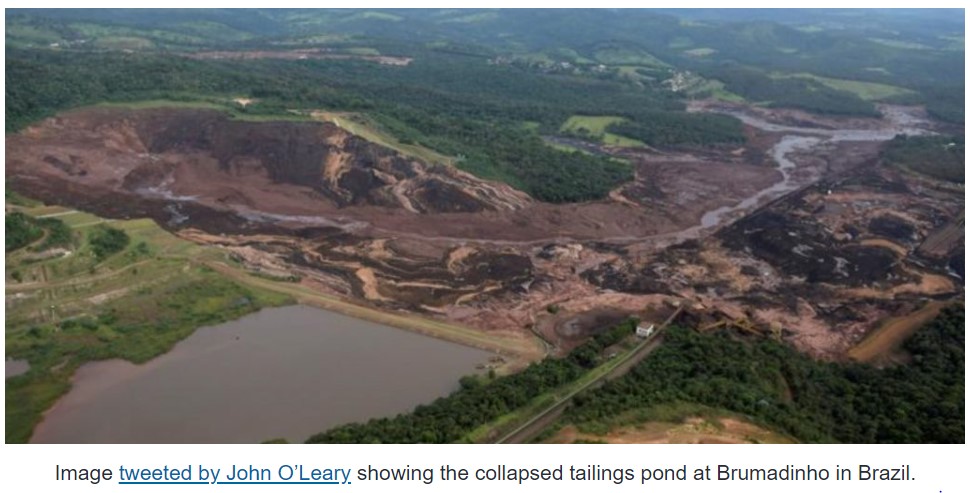
Our banner is an ever-looping image of the actual failure by flow failure of Vale’s Dam I at the Córrego do Feijão mine near Brumadinho. This site will eventually have our complete preliminary assessment and an annotated bibliography of resources providing authoritative background information relevant to this failure, which ranks as the 5th worst in recorded history, based on data available as of March 15, 2019.
ENGINEERING & TECHNICAL CAUSES OF FAILURE
On December 12, 2019 Vale released its expert panel technical cause of failure report While a very distinguished and highly regarded panel , their report, as most cause of failure reports is contractually limited to technical causes of failure devoid of the context of common practice, best practice or widely accepted standards for safe design and management of tailings facilities which have existed for decades in many cases.
Our approach is to present a complete failure narrative of cause and consequence with a view to loss prevention. The expert panel report looks at the same history we had already laid out below and in many instances comes to the same overall conclusions most importantly that this facility hovered in a state of marginal stability throughout most of its operating life and that that was not clearly recognized or fully understood by original owner Fertecu, by Vale, by any of their consulting engineers or by their in house geo technical personnnel.
The report, a real page turner consisting of a main text of 87 pages and 9 technical appendices in over 1,000 pages, arrives, through extensive mathematical modeling at a conclusion of flow failure by creep rupture arising from the particular characteristics of the tailings deposited over 37 years, an inherently poor design, and a dramatic increase in strain due to heavy rains in the previously unsaturated layer above the water level within the TSF. The analysis which guided dam design and each of its 15 raises, while following almost universal practices, was not reliable or appopriate for the actual conditions within the dam or the characteristics of the tailings with a result that these standard analyses consistently overstated stability.
The report settles many speculated and widely debated matters on where the failure initiated and what activities may have contributed to.failure. Our independent prior analysis was that the failure started at the top crest, that it was a flow failure and that the force of the failure of the stack cause the failure of the outer shell . This is also authoritatively concluded by the panel. They put to rest speculation that the DPN dewatering program and the hydrofracture event on June 11,2018 may have contributed; that a spring underneath the facility had contributed and that Vale’s driling program to install additional piezometers contributed.
As we had emphasized in our own analysis and discuss below they attribute a faulty design as a leading cause of failure revealing that the toe of the dam had blocked a creek that had historically drained groundwater resulting in constant and ever rising water levels within the structure. All recognized that de watering was absolutely essential to stability but the panel’s revelations explain why very little meaningful change had been realized after three years of trying.
In the 24 hours before the failure the TSF exhibited none of the deformations and cracks that would normally precede a failure. In the many months of very advanced monitoring no significant deformations were recorded.
What did happen, an abrupt facility wide failure , is typical of a creep rupture where a tiny additional strain can cause an abrupt, dramatic and complete collapse.
A copy of the report and all its appendices in both English and Portuguese is available at http://www.b1technicalinvestigation.com/pt/report.html . As we continue and edit our own analysis beyond just technical cause, below, we will bring in relevant sections of the panel report.
INTRODUCTION
Part of every narrative we will produce on all major failures in history will be the background of the mine’s development and ownership and the background to the entire life of the failed facility pre-failure. Failures are not sudden last minute unexpected unpredictable events. They form in part at design, in construction which often doesn’t follow design, in each raise, in the pattern and means of depositions, in the volume and characteristics of depositions, in the response to problems as they are identified over the life of the facility.
Commissioned causes of failure analysis have almost universally focused on “proximate cause of failure” as if the problem incubated and developed only in terms of the last sequence of geotechnical issues immediately pre failure. While both the Mt Polley and Fundao failure reports are an exception to that and the Mt Polley report in particular has been much quoted and cited as a blue print for change, it too was contractually limited in scope and purpose telling only part of the failure narrative. In fact,the failure and the conditions that lead to catastrophic failure are in the entire narrative of the mine itself and the way the facility has been used life of mine, and life of facility.
HISTORY SUMMARY
Dam 1 Córrego do Feijão Brumadinho had design, construction and drainage problems that, began to be identified as early as 1993 with the 4th raise pointing to whether an upstream dam was the appropriate choice for sinter fines. Our data points, spanning 24 years and all from the dams own history and records, suggest the dam has hovered in a very vulnerable state for as long as two decades with its condition not fully understood and its stability erroneously affirmed year by year in positive stability reports made to and accepted by government.
Capacity most usually and in the life of a dam considers only volume and the creation of additional volume. It doesn’t most often consider the existing stability of the structure, the stresses and effects of added volume, the implications of changes in the characteristics of tailings over time as grades fall and the characteristics of ores which may come to be significantly at variance with design assumptions. e.g. at Mt Polley the deviation from a good design to an ad hoc set of upstream raises originated in a failure to identify the acid generation propensity of materials from the new source so there was wasn’t enough non PAG material to continue the center line design. Mt Polley was exempt from stability analysis because its hazard class was grandfathered as presumptively low risk. Mt Polley resisted the repeated calls of its own design engineer and from its own consultant to have a stability analysis.
Many of the conditions shaping the risk of failure were already formed and uncorrected as of 2001 when Vale acquired the dam as part of its acquisition of three mines from German copmany Ferteco.
We have been looking at failures for 5 years and we do not see in the history of any catastrophic failure evidence that pre acquisition there was any assessment of the condition or capacity of existing tailings facilities ( or even an assessment of accrued liabilities or quality of the remaining unmined mineral deposits). We do not see that at Dam 1.
It is not clear what intervention, when, (whether prior to or after Vale’s acquisition) might have averted failure even if the actual risk of a liquefaction failure had been recognized. Records show that Vale was itself attempting to de risk Dam1 beginning in 2016 when all depositions ceased. TüV SüD in 2017 reported some progress in getting control of the water level and made several recommendations all with extreme caution on the vulnerability of the dam but it appears that the attempt to de risk was too late.
The critical state of the dam was clearly not fully appreciated by Vale as employees and their families were having lunch in the cafeteria right in the path of the failure flow and we counted 30 workers in many locations all over the dam at failure.
The susceptibility to flow failure was first examined in a thesis (2010) and later journal article (2013) both by a Vale Geotechnical engineer but neither actual official project documents, nor to our knowledge a basis for what is referred to as “the required Vale methodology”.
As of April 1, a total of 17 tailings dams in Brazil are deemed by authorities to be in critical condition, all of which received government affirmations of adequate stability per law in effect since 1993 as Brumadinho also had. Four of those dams are deemed at imminent risk of failure and may, as Brumadinho, be too late for any effective de risking and stabilization.
Neither the Government nor any experts have set in place a clear independently reviewed plan for de risking. Uninformed attempt to decommission could itself trigger failure at these other dams.
The Dam1 Córrego do Feijão story compels an examination of the entire life of this dam with a view to assessing when in its history and by what means this failure could have been averted. Was it already too late when Vale took it over in 2001?
The failure of dam 1 ‘Córrego do Feijão, Brumadinho, is a particularly excellent poster child for how failure conditions form over a long time not just in the geophysics , conditions, and characteristics of deposited tailings but the attention paid to it in government policy, miner priorities and by investors who include companies in their portfolios without taking account of liabilities in a company’s entire tailings portfolio. .
Vale, one the world 5 largest mining companies has been rattled to the core by Brumadinho. Already there have been major divestment announcements and a Moody downgrade of Vale’s credit to Junk. ( ). This marks the first change in investor awareness of the catastrophic tailings phenomenon. In July of 2015 just weeks before the Samarco failure when it was already inexorably formed according to the Fundao Panel, Fitch Ratings gave an enthusiastic thumbs up to its bonds for expansion ( ). But still the overall investors are still asleep. KPMG a leading analyst in the minerals sector doesn’t mention tailings condition portfolio wide as a key facet of sector wide risk or in the portfolio of specific companies. In its most current risk assessment. ( ). At miner webinars ESG folk never mention or ask about tailings. Brumadinho will surely bring a sharp awakening.
The history of Dam1 pre failure shows the important connection between production volumes and miner presented unit costs which investors emphasize and the invisible evolution of problems at a given miners waste facilities which could erupt to community and investor losses.
DAM DESIGN
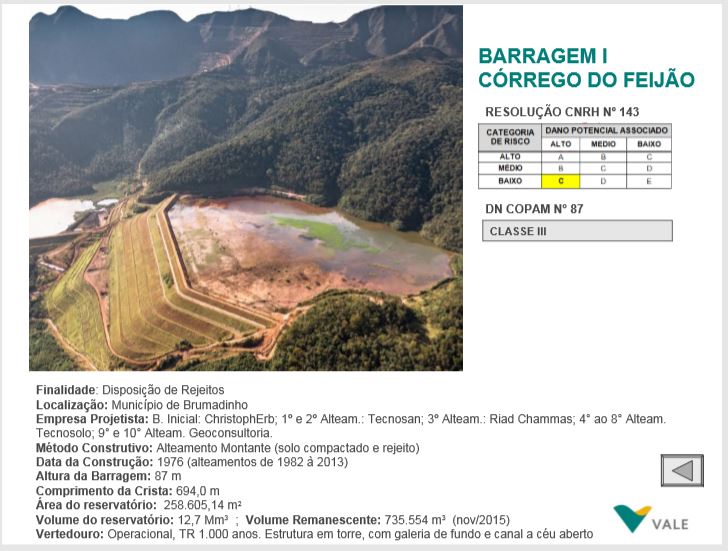
Stability begins with dam design, with selecting a construction method suitable to the tailings to be produced, a site that does not present constant stability hazards from water flow or other upstream conditions ( erosion, rock slides water flow etc,) We do not have the actual design report by German Engineer Christopher Erb but TUV SUD in its 2017 stability analysis confirms that it was designed as an upstream dam, with an intended maximum capacity of 12 million cubic meters and a design height of 87m. and an upsteam slope of 1V:1.5H . Mining production started at Corrego Do Feijao in 1963 and Dam 1, placed in servuce in 1976, was specifically for its sinter tailings. The elements of this original design, its initial first choices on type of construction, site, design height and slope and rate of deposition set up the stability challenges that recurred and grew over the life of the facility.
We are not yet sure of the details but the data available suggest that there was an operating manual for the dam if not at design early in its history. That manual apparently provided that it was designed and managed to a factor of safety of 1.3. It is not clear whether this was per Christopher Erb original designer or later nor is it clear whether 1.3 was in the 70’s to early 80’s considered reasonable for a large steep upstream TSF. As of 1993, however, Brazils TSF standrds required a minimum factor of safety of 1.5 for Dam 1.
Over the span of the life of this facility, 1976-2019, there were continual major leaps in what constituted good design, especially for upstream dams, the least resilient of the major sub aerial TSF construction types. Experience at the dam pointing to design flaws or construction errors and the written works evolving standards can and should guide corrections over the life of the dam. Both stimuli for correction (problems and new authoritative standards) came into being over the life of this dam but the response was limited and not effective in addressing or perhaps understanding fundamental problems that grew over time.
This was the only facility available for deposition from Corrego do Feijao so any substantive corrections to Dam 1 might have required mining interruptions. In many catastrophic failures, as we will bring out in our rewrites of failure narratives, avoiding mining interruptions has been a major deterrant to complete assessment and correction problems that came to mature to serious high consequence failures.
The main corrective responses that could have been taken and would have averted failure,e.g. a flatter profile, better drainage and strengthening of the foundations with a rock fill buttress were not undertaken in response problems which emerged early in the dams life at a time when major dam design revisions might have resulted in a workable design with higher life of mine stability, albeit it a likey much reduced total design capacity. This important principle was well illustrated in, “A Tale of Four Upstream Dams” ( ) all of the same standard non site materials specific “off the shelf” design by the same designer. The one that didn’t tailor to actual conditions failed, those that were tailored survived and one performed well.
A fundamental aspect of achieving and sustaining satisfactory stability levels is continual attention to stability performance and continual adjustments toward improved stability. This is the heart of “Observational Method”
This failure began in a dam design that set up inherent stability challenges life of mine by not responding to early evidence of design problems affecting stability with needed modifications.
“The design of the initial dike of Dam I was prepared by CHRISTOPH ERB in 1975, Doc. [19], and was constructed in 1976. The structure was designed for the storage of the tailings produced at the processing plant ITM – CFJ. The initial dike was constructed out of fine-grained ore (with the ability to drain) and covered by a 4.0-m thick laterite layer on the upstream slope and a 1.0-m thick laterite layer on the downstream slope. This initial stage had its crest at 874.00 meters above sea level with a dam height of 18.00 meters.
Dam I was designed for successive upstream raises as the tailings accumulated behind the dam. According to Doc. [22], the initial dike was composed of homogeneous draining material (“ultrafine ore”) with crest at 874.00 meters above sea level and height of 18 meters. The upstream and downstream slopes were covered by laterite layers with thicknesses of 4 m and 1 m, respectively. The inclination of the upstream and downstream slopes were 1V:1.5H and 1V:1.75H, respectively. The downstream slope had a berm with a length of 5.0 meters at an elevation of 864.0 meters above sea level. On the downstream slope there was a berm at elevation 864.0 m with a length of 5.0 m. There is no record of the existence of an internal drainage system” Dr. Steven H. EmermanTranslation of Dam History from TUV SUD 2017 Stability Analysys(2019)
We did not have access to the referenced document 19, the original design but elements of the design as inferred seem to be the seeds of failure and to have set up forseeable problems that were never fully recognized or properly addressed.
DAM 1 DESIGN A MAJOR CAUSE OF FAILURE
Stability begins with dam design, with selecting a construction method suitable to the tailings to be produced, a site that does not present constant stability hazards from water flow or other upstream conditions (erosion, rock slides water flow etc.),a design formed with reference to best available knowledge and standards. We do not have the actual original design documentation by German Engineer Christopher Erb but the principle elements of Dam 1’s design are confirmed in documentation over the life of the facility. Other elements can be inferred from what was actually built in 1976 as a new TSF for the Córrego do Feijão o mine. (Mining production started at Córrego do Feijão in 1963) The elements of this original design, its initial first choices on type of construction, site, design height and slope and rate of deposition set up the stability challenges that recurred and grew over the life of the facility.
We are not yet sure of the details but the data available suggest that there was an operating manual for the dam, if not at design, early in its history. That manual apparently provided that it was designed and managed to a factor of safety of 1.3. (Techno Solo 1993) It is not clear whether this was per Christopher Erb original designer or later nor is it clear whether 1.3 was in the 7o’s to early 80s considered reasonable for a large steep upstream TSF. Given the level of understanding and common practice in tailings planning in the mid 70’s it is likely that the design was guided by ESA stability analysis and that the FOS 1.3 was for an undrained state.Throughout its life the TSF was not in an undrained state after the initial state dam. It had a continuous and evr rising phreatic surface.
Over the span of the life of this facility, 1976-2019, there were continual major leaps in what constituted good design, especially for upstream dams, the least resilient of the major sub aerial design types. Experience at the dam pointing to design flaws or construction errors and the written works evolving standards can and should guide corrections over the life of all dams. A well designed legal framework for mining should require that. Both stimuli for correction (problems and new authoritative standards) came into being over the 33 year life of this dam but the response was limited and not effective in addressing or perhaps understanding fundamental problems that grew over time.
Over its entire life, this was the only facility available for deposition from Córrego do Feijão so any substantive corrections to Dam 1 might have required mining interruptions. In many catastrophic failures, as we will bring out in our rewrites of failure narratives, avoiding mining interruptions has been a major deterrent to complete assessment and correction problems that came to mature to serious high consequence failures. Without specific statutory mandates and authority regulators have no control or input on such decisions.
The main corrective responses that could have been taken and would have averted failure, e.g. a flatter profile, better drainage and strengthening of the foundations with a rock fill buttress were not undertaken in response problems which emerged early in the dams life at a time when major dam design revisions might have resulted in a workable design with higher life of mine stability. This important principle was well illustrated in, “A Tale of Four Upstream Dams” Martin, McRoberts, Davies (2002), a case study of four identical all “off the shelf” designs by the same designer. of the same type of tailings, and all commissioned by the same owner/operator. (All dams of this designer were designed to an ESA based stability analysis (Davies-McRoberts 1999). The study was prompted by a flow slide at the prototype. Two that were modified to better suit deposition materials and site, one failed and one could not continue to receive any more tailings. By the designer’s assessment, still using ESA stability analysis when undrained conditions did not exist, the dam could have continued in use and would have but for the author’s re analysis.
A fundamental aspect of achieving and sustaining satisfactory stability levels is continual attention to stability performance and continual adjustments toward improved stability. This is the heart and purpose of “Observational Method”
This failure began in a dam design that set up inherent stability challenges life of facility by not responding with needed modifications to early evidence of design problems affecting stability.
“The design of the initial dike of Dam I was prepared by CHRISTOPH ERB in 1975, Doc. [19], and was constructed in 1976. The structure was designed for the storage of the tailings produced at the processing plant ITM – CFJ. The initial dike was constructed out of fine-grained ore (with the ability to drain) and covered by a 4.0-m thick laterite layer on the upstream slope and a 1.0-m thick laterite layer on the downstream slope. This initial stage had its crest at 874.00 meters above sea level with a dam height of 18.00 meters.
“The inclination of the upstream and downstream slopes were 1V:1.5H and 1V:1.75H, respectively. The downstream slope had a berm with a length of 5.0 meters at an elevation of 864.0 meters above sea level. On the downstream slope there was a berm at elevation 864.0 m with a length of 5.0 m. There is no record of the existence of an internal drainage system” (TUV SUD 2017)
The final design height was 87M and final capacity 12M cubic meters, which were the capacity and height essentially attained at failure.
In the next section specific elements of the Dam 1 design are presented against standards presenting current and most authoritative best knowledge.
CORRECT SITING OF THE TSF: Especially Bad Site For Sinter Fines
Correct siting of an above ground tailings storage facility is almost as important as stability in determining the long terms performance of the facility. At a mountainous potential mine site in Maine (Bald Mountain) right on the juncture of two watersheds, over 20 sites were evaluated and none afforded adequate environmental protections. Correct siting is especially critical for an upstream dam physically supported by higher surrounding elevations.
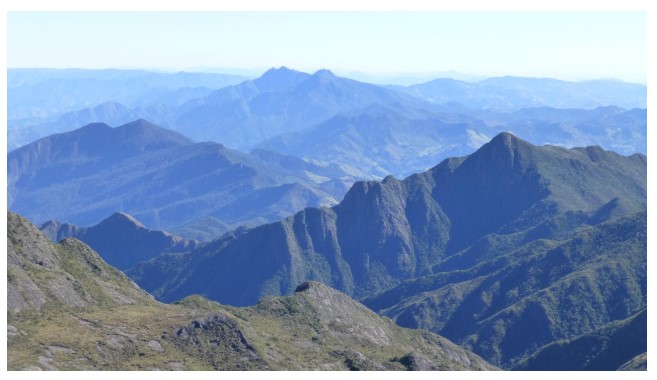
Minas Gerais, like Peru & Chile is an exceptionally mountainous area (Fig 1) so like many TSF’s in Minas Gerais, Dam 1 was built against a hillside where both the upstream crest and downstream face were always exposed to natural runoff from the considerable elevation above and behind the TSF site.
“..,[A} tailings pond that is expected to receive high rates of water accumulation (due to climatic and topographic conditions) should be constructed using a method other than upstream construction. Any change in environmental or operating conditions (heavy rainfall, blockage of seepage outlets, rise in water levels of the pond, etc.) resulting in a rise of the phreatic line and complete saturation of the outer sand shell could quickly lead to failure by piping or sliding.” (US EPA 1995) P3
This choice was in the context of a very small very tightly developed site of two adjacent mines. (Fig 2, Fig 3).
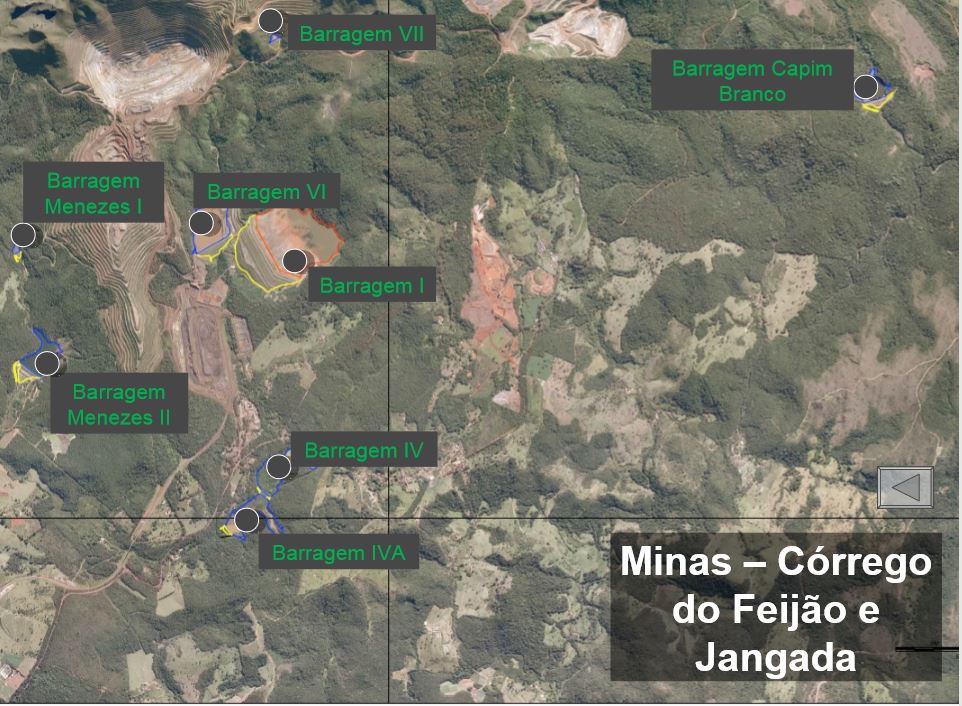
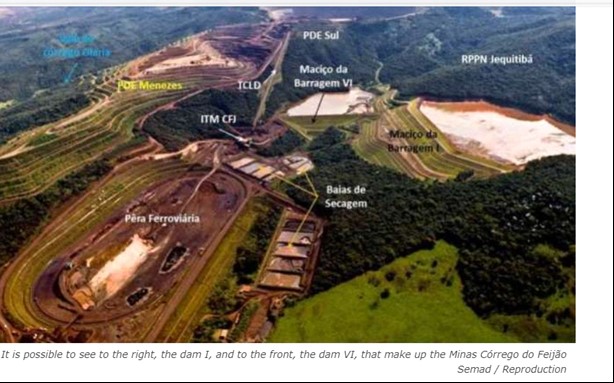
Figure 4 shows the steeply pitched elevation of natural landscape constantly above the beach.
These site constraints lead to a variant on the Valley Design, a three sided “Side Hill “ design.
“The valley dam design{ itself} is particularly sensitive to overtopping by flood waters, erosion near the intersection of the dam and the valley hillside, and liquefaction due to higher volumes of surface water inflow from drainages within the natural catchment basin and from high precipitation runon/runoff.[T}he stability of a valley dam depends largely on the level of hydrostatic pressure within fill material and the embankment. An unusual, one-time rise in the hydrostatic pressure above design levels may be sufficient to trigger failure. The control of inflows across, around, or under the impoundment is important to retaining structural stability and to controlling environmental impacts. Providing adequate internal drainage can help guard against liquefaction, and improve the permeability and consolidation of the tailings, thereby improving the stability of the structure.” (US EPA p 11)
Upstream a Wrong Choice For Sinter Fines
“The physical and chemical nature of the tailing slime depends on milling operations and water content in the effluent. The characteristics of the tailings dictate the type of disposal facility required.” Ghose & Sen (2001)
Upstream construction is inherently “delicate” and non-resilient and works best for cohesionless tails that drain easily and compact readily. Upstream was a bad choice for sinter fines which have a granulomtery and soil classification which is e subject to a rapid absorption and slow discharge of liquids. (Hu et al 2017)
“ “Compared to the copper tailings, the iron tailings showed higher compressibility, lower permeability, lower strength, and lower cyclic resistance. With the decrease in void ratio, the coefficient of consolidation almost kept constant for the fine iron tailings, whereas for the fine copper tailings, the coefficient of consolidation gradually increased. Under cyclic loading, the accumulation of pore water pressure was faster in the fine tailings than that in the coarse tailings.
“Fig. 1 indicates that the mass percentage of grain size less than 0.075 mm is 14.9% for the coarse iron tailings, 78.4% for the fine iron tailings, 14.24% for the coarse copper tailings, and 61.12% for the fine copper tailings. It is worthwhile noting that the grain size distributions of the two coarse tailings are almost the same, and both present an average particle size D50D50 of 0.12 mm. The D50D50 of the fine iron tailings (0.03 mm) is smaller than that of the fine copper tailings (0.06 mm)”
Especially without strength in the shell of the facility, the nature of the tailings themselves presented a constant challenge to the chosen construction type. Although it may exist, we have not seen the early granulometry of the sinter tailings which are described by Erb, the designer, as “easily draining”.
“For the initial massive project of dam I geotechnical investigations were carried out, but there are no records of the types of tests. Some information contained in the report, the original German, prepared by CHRISTOPHER ERB in 1975, Doc. [19]. The parameters obtained for the materials of construction are presented in Table 6.2″
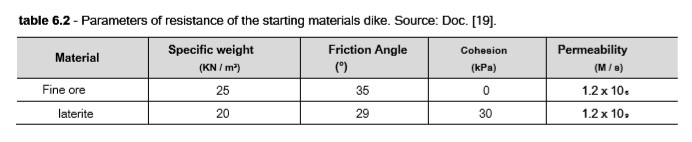
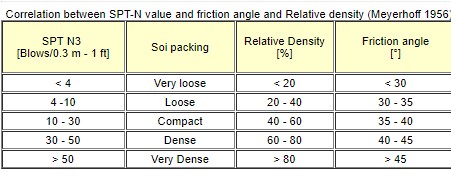
Soil friction angle is a shear strength parameter of soils. It is used to describe the friction shear resistance of soils together with the normal effective stress. A friction angle of 30 or less corresponds to a very loose soil.
Zero cohesion and 35 friction angle correspnds to “silty gravel” ,GM-GL,“ per the table below .
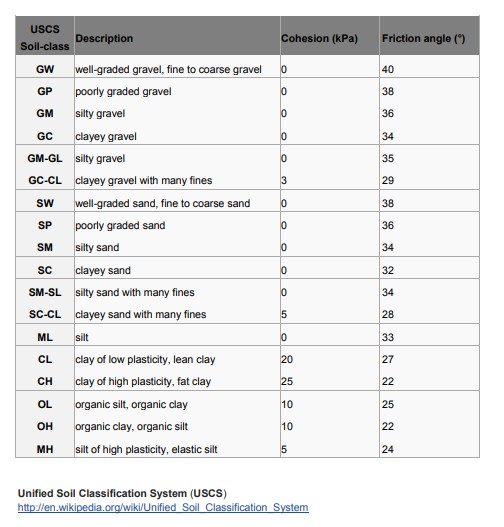
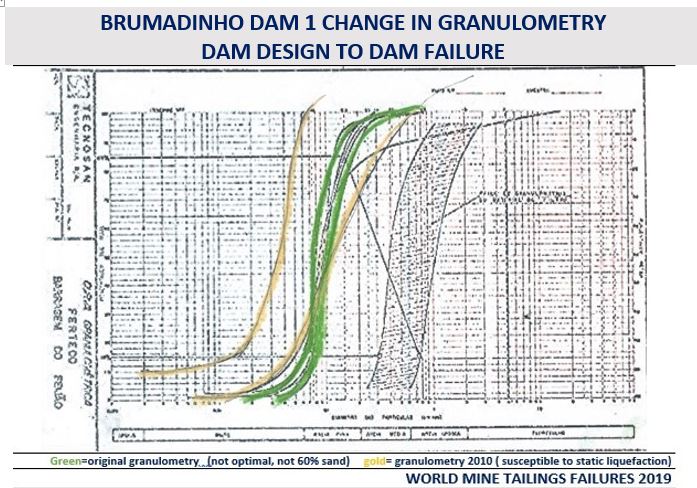
The date of the following granulometry by Technosan for Ferteco isn’t clear but it is close to the time of design and is consistent with the “silty gravel” soil classification. It is marginal with respect to patterns associated with static liquefaction but is clearly not the 60% sand recommended as a safe boundary for upstream construction (Vick 1990) nor what might be described as immune to static liquefaction.
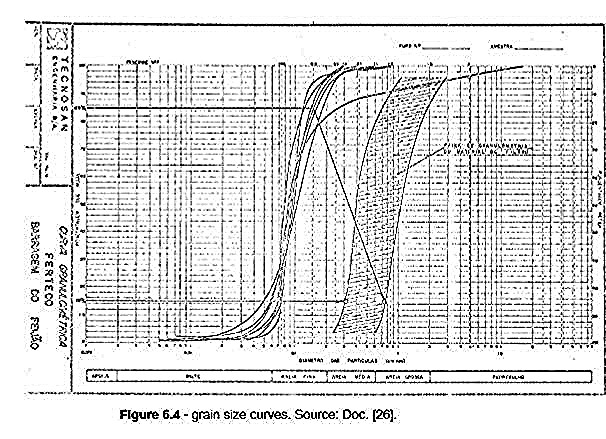
We can see that by 2010 the granulometry of the tailings had shifted considerably into a pattern strongly correlated with liquefaction but we have no details on the pre deposition granulometry of the tailings at each raise.
Also sinter fines fail to provide sufficient strength on which to build each new dyke.
“The single most important criteria for the application of the upstream construction method is that the tailings beach must form a competent foundation for the support of the next dike. Vick (1990) states that as a general rule, the discharge should contain no less than 40 to 60 percent sand. This can preclude the use of the upstream method for those mill tailings that contain very low percentages of sand. Other references state that the determining factor for upstream versus downstream construction is grain-size distribution of the tailings. In addition to grain size tests, Brawner, et al, (1973) suggested that, “If a tractor cannot be operated on the first 100 to 200 feet of beach, the grind is too fine for upstream construction methods. “(US EPA 1995)
This post is being worked on..please bear with us. What is so far up is pending peer review and is the sole responsibility of Lindsay Newland Bowker. Corrections (with documentation) and comments welcome April 15,2019)
Slope Too Steep For An Un Buttressed Upstream Dam In General Particularly Bad For Tailings Contractant Under Stress In A Side Hill Attachment to Surrounding Natural Topography
The design declination was 1.5H:1V where by modern standards the original 10 commandments of safe upstream construction (Martin McRoberts 1999), 3H:1V. Maritn, McRoberts Davies set even stricter safe guidelines
” If an upstream constructed dam is raised at a slope steeper than 4H:1V, the likelihood of a static undrained failure due to minimal trigger is increased. Accordingly, upstream dams should be raised at slopes of 4H:1V or flatter. 1.” (Martin Mc Roberts Davies 2002)
Not only does the Dam 1 original design exceed what is generally considered safe design standards for upstream construction, but the choice of upstream construction and hillside attachment compounded elevated vulnerability and risk arising from the characteristics of the tailings. The steep incline further compounded inherent risk in the original design.
The steeper the incline the greater the pressure of any accumulating waters and associated pore pressures against the toe of the dam. The higher the susceptibility of the tailings to liquefaction, the higher the risk of recurring very high pore pressures from both water level and capillary forces.
Side Hill construction requires an even flatter profile than the 10 commandments rule on upstream construction.
“The side-hill layout consists of a three-sided dam constructed against a hillside (Figure 4). This design is optimal for slopes of less than 10% grade”. (US EPA 1995) p 9
Starter dam/foundation height not conservative enough to contain the force of a critical flow
In contractant materials like sinter tailings full saturation can occur very quickly, in a matter of hours, and take a very long time to dissipate. (Rodriguez) A thick capillary layer can increase both water level within the dam and pore pressures against the wall of the impoundment. The rule of good design (and common sense) requires a foundation thick enough and high enough to withstand the pressures of a critical water level. For a planned 87 M dam a starter dam of earthen materials and only 18 m in height is not conservative where the nature of the tailings poses a significant threat of reaching a critical water level several times over the planned life of the facility. A contemporary, flatter but otherwise very similar laterite reinforced side hill attached upstream dam in Cuba (Pedro Sotto Alba) had recurring problems throughout its life resulting in several very significant failures. (Rodriguez-Oldecorpe et al) One of the key features of correction was a significant increase in the starter dam height and a full buttress re enforcement. (Cepero 2008).
Planned and Executed Rate of raise within general modern guidelines but Sinter Tails much slower to consolidate and dry out
“The rate of raising of the dam must be sufficiently slow such that there is a sufficient degree of dissipation of excess pore pressures in the outer shell and in the slimes, and such that excess pore pressure buildup does not occur in foundation materials. Vick (1990) suggests that, for rates of impoundment rise of between 4.6 to 9.2 m/year, excess pore pressures are usually assumed to dissipate as rapidly as the load is applied, and therefore a normally consolidated state (i.e. zero excess pore pressure) can be assumed” (Martin, McRoberts Davies,2002)
The standard is based on a performance criterion not an assumed equally safe rate for all materials. Contractant fines require longer settlement time because they are slower to dry out.
This dam design anticipated that the overall height of the facility would be increased at a rate of 2.2 M per year (87/26) well below guidance but not necessarily adequate to meet the performance standard. it is not clear that a safe rate of deposition was ever calculated within the design parameters and actual tailings conditions or whether the planned rate was simply based on needed capacity for production goals.
Planned Hydraulics Not Adequate to Maintain Continuous Drained State When an upstream dam, especially a side hill or cross valley design is not designed to be maintained in a continuous undrained state (no phreatic surface within the dam) the risk of failure is greatly elevated life of facility. It appears from documented events over the life of the facility that there were no interior drains included as part of dam design but without the original design documents we cannot assess the hydraulics planned life of mine. As we see in the next section drainage problems were apparent from the outset of this tailings storage facility.
OVERALL ADEQUACY OF ORIGINAL DESIGN FOR LIFE OF FACILITY STABILITY
Modern guidance, based on almost 100 years of experience with these dams is that the upstream dams don’t get a 90% grade for missing one of the essential criteria for stability. All of the criteria must be met in design and maintained life of facility to assure stability, that is to prevent failure.
This dam design violated many principles considered essential for a safe stable life of facility design including the fundamental choice of an upstream dam for sinter fines. As an initial design for these tailings materials in this location the design would have to be considered a major contributor to failure limiting workable options for correction over time.
It was a design where the inherent weaknesses would increase over time. Its susceptibility to liquefactions would predictably increase over time to a near permanent undrained state. ( The recently released expert panel reportalso characterizes this as the life of service of Dam 1) This in fact is considered a risk so inherent to upstream dams that the guidance is that ESA undrained assumption is considered ill advised in most but not all instances for an upstream dam. (Martin McRoberts 1999)
“A great many upstream tailings have been, and continue to be, designed and/or evaluated based on limit equilibrium slope stability analyses assuming only ESA parameters. ESA analysis for upstream dams in many instances is based on fundamentally incorrect assumptions regarding pore pressures prior to and during shear failure, and can result in large overestimates of the factor of safety.USA analysis should be applied for staged construction, and upstream tailings represent a classic case of staged-construction.” Martin-McRoberts 1999 P3
The Maritn McRoberts Davies (2002) rule is that both USA and ESA should be done as part of dam design and the lower result taken as design guidance.
“ Design analyses must include both undrained strength analysis (USA) and effective stress analysis (ESA), with design controlled by the analysis type giving the lowest factor of safety. A wide range of factors including material type, degree of consolidation and stress path must be assessed in assigning the appropriate USA strength” P3
The point of Martin McRoberts Davies (2002) is that an initial bad design can in some instances be corrected to a safe and stable operating condition even where one or more of the critical 10 rules’ are broken.
“” Of the 10 rules, a “score” of 9/10 will not necessarily have a better outcome than 2/10, as any omission creates immediate candidacy for an upstream tailings dam to join the list of facilities that have failed due to ignoring some or all of the rules”
All of the 4 dams in a Tale of Four Upstream dams violated 6 of the 10 rules for safety of upstream dams and the protype of the design had experienced a flow failure. Two underwent significant reconfiguration with prospects for a good long-term result. The one which made no corrections had a flow failure. One was closed as a result of the Martin et al analysis. The designer and operator would have put it back in service. A parallel and contemporary of this design, Moa Nickel in Cuba, had several very significant tailings failures before major changes were made, starting in 1997, including strengthening of the shell and heightening of the starter dam. Dam 1 though is much steeper and larger and lacked critical drainage elements under the starter dam so it is not clear what measures and when would have prevented this failure.
As we discuss in the next section from early on in the life of Dam 1 Corrego do Feijao Brumadinho there were many indicators of significant design problems but except for a few months in 2005, depositions continued without interruption until 2006 .
Sub Chapter Bibliography
Cepero 2008 Eudel Eduardo Cepero “The Dirty Side Of Nickel” Association For the Study of the Cuban Economy , November 2008 https://www.ascecuba.org/asce_proceedings/the-dirty-side-of-moa-nickel-a-critical-view-from-space/
Ghose & Sen 2001 https://www.ncbi.nlm.nih.gov/pubmed/11336411
Hu et.al 2016 Liming Hu, Ph.D., A.M.ASCE; Hui Wu; Lin Zhang; Pengwei Zhang “Geotechnical Properties of Mine Tailings” Journal of Materilas In Civil Engineering Volume 29 Issue 2, February 2017 https://ascelibrary.org/doi/full/10.1061/(ASCE)MT.1943-5533.0001736
Martin McRoberts Davies (2002) T.E. Martin, E.C. McRoberts, M.Davies “ A Tale of Four Upstream Dams” https://drive.google.com/file/d/10O“mQsZuI-bHLjSgYWiOXSccFg4p5Kc3N/view?usp=sharing
Martin McRoberts 1999 T.E Martin, E.C.McRoberts “Some Considerations in the Stability Analysis of Upstream Dams” Colorado State University; Department of Civil Engineering; Geotechnical Engineering Program International conference; 6th, Tailings and mine waste; 1999; Fort Collins; CO in TAILINGS AND MINE WASTE ; 287-302 http://citeseerx.ist.psu.edu/viewdoc/download?doi=10.1.1.586.6753&rep=rep1&type=pdf
Rodriguez-Oldecorp “Satability of Tailings Dams Considering the Hydro-mechnaical Behavior of Tailings and Climate Factors” https://www.researchgate.net/publication/263739172_Satability_of_tailings_dam_considering_the_hydro-mechanical_behaviour_of_tailings_and_climate_factors
TUV SUD 2017 “Dam Safety Perioidc Review of Dam Safety (RPSB)” Barragem 1, Corrego Do Feijao
US EPA 1994 “Design & Evaluation of Tailings Dams” EPA-530-R-94-038 NTIS PB94-201845 https://archive.epa.gov/epawaste/nonhaz/industrial/special/web/pdf/tailings.pdf, August 1994
Vick 1990 Vick, Steven G. Planning, Design, and Analysis of Tailings Dams (BiTech Publishers Ltd. 1990).
Zandarin et. Al. 2008 ”María T.Zandarína1Luciano A.OldecopaRobertoRodríguezb2FranciscoZabalaa1
https://doi.org/10.1016/j.enggeo.2008.12.003
This subchapter is the sole responsbility of Lindsay Newland Bowker and is posted pending peer review and sign off by chief Compiler Engineering Roberto Lorenzo Rodriguez Pacheco. Please submit any comments or corrections to me at compiler@worldminetailingsfailures.org. We would especially appreciate any photos of the dam at construction and in its early life ( 1976-1986)
STATIC LIQUEFACTION LIKELY CAUSE OF FAILURE AT CÓRREGO DO FEIJÃO DAM I
It seemed likely from the first descriptions and images of the Córrego do Feijão Dam I failure that the cause was static liquefaction, a transformation of the nature of the tailings resulting from over saturation that makes them perform more like water than soil, causing a greater force that propels released tailings much farther than the same volume of compacted tailings would travel in a foundation failure. Initially some experts viewing the video of the actual event opined that, while a liquefaction event clearly occurred, it was not clear whether it followed from or caused the failure. The lower part of the dam had been previously identified as key to overall stability and also a place of vulnerability. The expert panel report released December 12, 2019 confirms that static liquefaction occurred at the crest and was the cause of failure of the outer shell. Static liquefaction was under active consideration by Vale and its engineers in 2017 and 2018 .
Fundão, Stava, Merriespruitt, Los Frailes, Sullivan Mine and Pinto Valley are a few well-known examples of static liquefaction failures in history. At Merriespruitt, as at Fundao and Brumadinho stability analysis per prevailing methods found the dams safe. That prevailing practice is not, however, best practice/best knowledge is a subject of growing interest and concern that has evolved over at least two decades. It has forced a re-evaluation of what was taught in mining schools and has been best knowledge for a large part of the worldwide community of dedicated mining engineers. It is not now a major focus of education and apprenticeship as the world’s future engineers set to work. A great deal of knowledge has been advanced by our Chief Compiler, Engineering, Roberto Rodríguez Pacheco, by revered engineers such as our colleague Andrew Fourie , by the venerable Mike Davies and Todd Martin, and by Norbert Morgenstern among many others.
Their insights and urgings have not found their way into government regulations on stability and are not shaping main practice or even main stream discussion. It is just not part of the thought and decision making that has shaped the world’s existing portfolio of some 18,000 TSFs (Tailings Storage Facilities) and those that are planned to receive the world’s mineral production this decade.
In 2002, just as Vale acquired the 3 mines of which Dam 1 was a part, Davies, Martin & McRoberts wrote:
“Design practice in many mining regions has in fact discounted the possibility of the mechanisms and criteria for this failure mode, the possibility of its occurrence has often been overlooked in the search for other causes of failure.
The simplistic view is that by defining the friction angle and pore pressure of the sand, we can predict the strength of that sand, the drained strength. The exception these references allow for is sands during an earthquake when the sand may become ‘liquefied.’ Clays on the other hand are deemed to be cohesive and have an undrained strength. Those readers who have benefited from a more enlightened geotechnical education may not find this a credible proposition, but it is clear to the authors that even as we enter the 21st century, a range of educators, regulatory and quasi-governmental groups, and an alarming number of geotechnical consultants still have not un-learned their first series of lectures in soil mechanics based on textbooks expounding the views noted above. Until these simplistic models have been un-learned by all involved with the design, licensing, and construction of tailings impoundments, a major contributor to failures, i.e. inappropriate and incorrect designs based upon a lack of understanding of the tailings strength, will continue. ” (emphasis added)
Davies, McRoberts, Martin ( 2002)
In late summer 2018, just months before the Dam 1 faiure, Dr. Morgenstern wrote:
“From a technical perspective, it is of interest to note that inadequate understanding of undrained failure mechanisms leading to static liquefaction with extreme consequences is a factor in about 50% of the cases. Inadequacies in site characterization, both geological and geotechnical, is a factor in about 40% of the cases. Regulatory practice, considered appropriate for its time and place, did not prevent these incidents. However, the most important finding is that the dominant cause of these failures arises from deficiencies in engineering practice associated with the spectrum of activities embraced by design,construction, quality control, quality assurance, and related matters. This is a very disconcerting finding.” Morgenstern, The Melo Lecture August 2018
It is in this dark crevasse of “unknowing” that Córrego do Feijão Dam I matured to the 5th largest failure ever in recorded history, based on what we have now as deaths, runout, and release.
EXPLAINING STATIC LIQUEFACTION
To understand the meaning of the 4 technical papers considering static liquefaction susceptibility of Dam1 which we present below, and to understand the severity of the unmeasured risk static liquefaction presents in existing still in use TSF’s globally, it is important first to understand what static liquefaction is and how it arises. This paper prepared for us by Dr. Roberto Rodriguez Pacheco is a current “best available knowledge“ on static liquefaction. Dr. Rodriguez, who has 20 years of experience in tailings management facilities and tailings hydromechanical behavior, is our Chief Compiler, Engineering Causes here at World Mine tailings failures..
Susceptibility to static liquefaction is primarily, but not exclusively, a function of the water level within the tailings impoundment. All depositions at Dam 1 were of a mostly liquid slurry of sinter, a residue of processing iron dust with other minerals. If the rate of deposition of these very liquid materials allows sufficient time for consolidation and drying, the mass for many types of tailings will become compact and stable. The weight of the of the solid part of the tailings will settle (as when cooking flour will not remain in suspension but will settle to the bottom) and liquid will float on top where it can be drained off and will evaporate. The weight of additional tailings settling into the dam will also force water out to the bottom of the stack where ideally with proper drainage it will be diverted to a holding pond maintaining no water level within the dam itself under the deposition.
Most dams of slurried depositions have a water table due to omission of adequate drainage in the original design or to improper construction or simply omission of drainage as designed ad approved. Water within the dam under the tailings is more common than not.
Stability of the dam has very strict limits with respect to any water table within the dam. If depositions occur too fast or if the drainage system is impaired, missing or inadequate, the level of the water table will increase in depth. ). Equipment called “piezometers are built into the dam and give actual measurements of where the water level is.
The expert panel report released 12/13/19 confirms that these were critical factors in Brumadinho Dam 1 . Inadequate internal drainage coupled with continual influxes from groundwater that that had no exit point due to the dam itself blocking the pre construction drainage resulted in a chronic and continually expanding saturated area within the dam encompassing the entire structure up to the upper crests.
Although wrong methods for a dams actual materials and analytically outdated methods will give a large variation in factor of safety results, a critical water level can be established for any dam height and type of materials called a factor of safety. 1.0 is the failure threshold level. 1.5 has for many years been considered a minimum for all dams rated as high hazard as Brumadinho was.. Brazilian Law since 1993, the entire time Vale has owned and managed Barragem 1, has stipulated that standard but is framed in a way that allows much discretion and variation and so does not work well as an actual measure of the degree of risk in its licensed facilities.
For example stability per the the federal standard for Brumadinho was certified only by the ESA method which is valid in application only to a dam in an undrained state. ( no flowing water.) Flowing water did exist , was acknowledged to exist, so the only valid methods were USA ( Undrained stability Analysis) .By that indicated method Brumadinho had factors of safety far far below the the Federal standard of 1.5.
Fs=1 ,is the failure threshold and ocurrs when the water level within the dam is >=o.6 . of the height of the dam.
Brazilian law since 2017 ( we have not seen the text of the earlier regulation) requires that the characteristics of the materials be considered and the method appropriate to its drained or undrained state be employed. Drained means that the TSF has been determined to have no flowing water level in the dam. Un drained means there is a flow of water present. Calculating a factor of safety on an assumption of undrained conditions would exaggerate the factor of safety if in fact there is a flow of water within the dam.
Whether or not there is a flow of water in the dam can be measured with piezometers and the relationship between the dam surface and the water table surface would determine undrained stability.
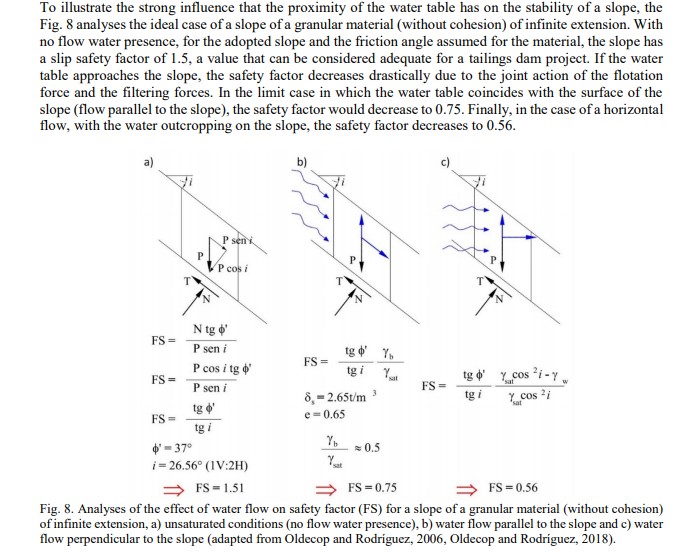
The influence of water table level proximity to and angle with the surface of the dam is illustrated below. (Rodriguez-Pacheco 2019). Condition A,when there is no measured actual water flow within the damt here are no pressures on the dam face. When the water flow is parallel to the surface of the dam it would exert pressure on the toe of the dam ( condition b failure). If the flow is perpendicular to the face of the dam it will erupt through the face of the dam ( condition C failure)
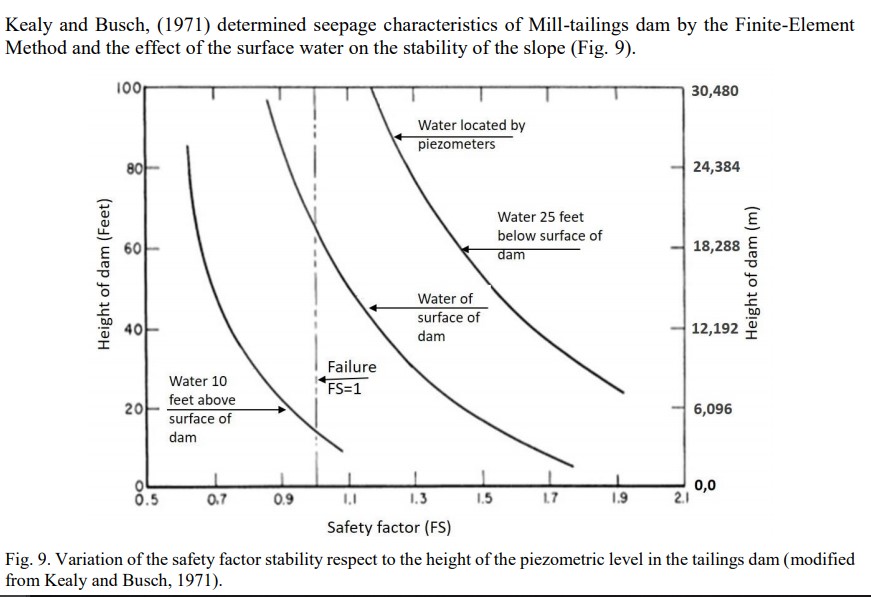
How the height of the dam affects the susceptibility to failure relative to the height of the water table is given below (Rodriguez-Pacheco (2019)). For a 60 ft high dam to have a factor of safety of 1.5 or greater its water level within the dam must be more than 25 ‘ below the surface. ( 60% of dam height) It is not possible for an 80ft dam to attain a fs 1.5 with a water level 25 ‘ below dam surface. Brumadinho Dam1 did not meet this crietrion. Below are have illustrations of actual levels of water pre-faiure.
Dr. Rodriguez emphasizes that the main deficiency of the current tailings dam monitoring systems is the inability to detect the capillary height, the degree of saturation and the suction of the tailings. For this reason, the loss of the margin of the safety factor can occur without any external signal on the dam.
The capillary height in tailings varies between 0.6 and 20 meters for sand and silty-clay size particles respectively (Oldecop and Rodríguez, 2006). The negative effect of capillary water is that the degree of saturation remains high. Due to this, during an important strong rain the phreatic surface (PS) rises very quickly (in hours) and after the storm the SF descends slowly (days) (Zndarín et al., 2009). Capillary water can’t be drained by gravity (vacuum) and, what is more serious, it is not detected with traditional auscultation equipment! (piezometers).
“Tailings storage facilities are complex geotechnical structures. The present paper focuses on the study of a case-history, a tailing dam from the nickel industry located in Cuba, with the objective of gaining knowledge about the geotechnical behaviour of such structures. The dam behaviour was modelled by means of a coupled hydro-mechanical finite element formulation. Due to the low permeability of tailings, the phreatic surface in the deposit remains high during and after its construction. Steady-state flow regime would be reached only several decades after closure. Moreover, capillary rise causes the saturation degree to stay high in the whole storage. Under the action of rain storms, phreatic levels rise quickly due to the presence of capillary water. Following the end of the storm, phreatic levels fall slowly because of the low hydraulic conductivity. The results of the analysis show that the stability of the dam strongly depends on capillary phenomena.“”The role of capillary water in the stability of tailing dams”María T.Zandarína1Luciano A.OldecopaRobertoRodríguezb2FranciscoZabalaa1
https://doi.org/10.1016/j.enggeo.2008.12.003
In all cases of flow failure in tailings dams the following elements were present, the dam was saturated, the drainage system was rigid or defective, the tailings were on unconsolidated materials (Fig. 2). The EU recommends for upstream tailings dams raising rate restrictions less than 5 m/years (this is equals to 14 mm/day), to avoid insufficient consolidation and pore pressure build-up (EU, 2009) The key is water balance and tailings dam-water cycle. Why? Input = Output ± Storage coefficient (4) The water Output has to be always bigger than the Input to guarantee that the tailings are in unsaturated conditions, fundamentally in the area near the dam (beach, Figs. 2). The hydraulic operation of the tailings dam is decisive for its stability during operation and after tailings dam closure. Infiltration and evapotranspiration are the two key parameters. Fundamental controls on tailings consolidation and water Output are exerted by the bulk tailings properties of grain size, packing, stratification, permeability, desiccation cracks and strength, which together determine whether consolidation will occur and, if so the course it follows, and by external disturbances which act to trigger liquefaction and fluidization. The liquefaction and fluidization of tailings (sand, silt, silty-clay) usually accompanies the collapse of loosely packed cross‐bedded deposits (stratification in tailings dam basin due to change in point of discharge). This collapse is commonly initiated by water forced into the units as underlying beds, especially sands and silt, consolidate. The consolidation of subjacent units is often triggered by the rapid deposition of the tailings itself, although earthquakes or other disturbances are probably influential in some instances
DOWNLOAD RODRIGUEZ STATIC LIQUEFACTION SUMMARY
ADDITIONAL STATIC LIQUEFACTION/FACTOR OF SAFETY BIBLIOGRAPHY
Some considerations in the stability analysis of upstream tailings dams January 1999T. E. Martin Ed Mcroberts
https://www.researchgate.net/publication/255509946_Some_considerations_in_the_stability_analysis_of_upstream_tailings_dams”January 1999T. E. Martin Ed Mcroberts
“The authors support the view that for upstream dams constructed of contractant, potentially liquefiable tailings, both undrained strength analysis and steady state strength analysis should be considered, and that effective stress analysis for such structures can be fundamentally incorrect and unsafe.”
“The minimum FoS for embankment dams in Australia were discussed in “Current Technical Practices for Design, Construction, Operation and Maintenance of Large Dams in Australia” published by the Australian National Committee on Large Dams in 1969 (ANCOLD, 1969). The FoS was noted to vary considerably according to the type of analysis, pore water pressure assumptions, extent of investigations, anticipated quality of construction and other factors. In recognising the many factors influencing slope stability, ANCOLD (1969) provided the minimum FoS only when determined from the Swedish Slip Circle or Wedge analyses and with reasonably conservative strength parameters. The recommended minimum FoS for the downstream shoulder of dams under a steady state seepage condition was 1.5, while the minimum FoS for end of construction, initial filling and rapid drawdown were somewhat lower.
“The FoS = 1 condition in LE means that the shear resistance along a selected shear surface is in equilibrium with the destabilising forces and/or moments. The FoS = 1 condition in FE means that that the shear strength at failure is reached and the modelled slope is failing. Given that FE models are based on the stress/strain soil behaviour concept, the slope failure criterion is frequently defined as the state of large (infinite) strains resulting in non-convergence of the static FE model solution. In simple terms, the failure occurs when the static FE mesh representing the soil mass is torn by the displacement. Due the conceptual differences between LE and FE methods, the FoS calculated in each of these represent different states although the FoS values may be very similar. The comparison of LE and FE methods are detailed in numerous publications including Abramson et al (2002) and Aryal et al (2005) and further discussion on the numerical stability assessment methods is beyond the scope and objectives of this paper.
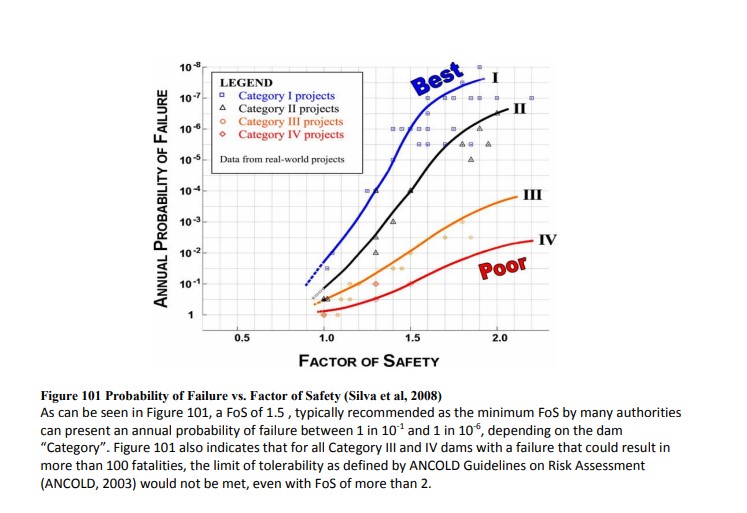
As outlined earlier, the impact of uncertainties and reliability of input values was recognised many decades ago and Smith (2003), Silva et al (2008) and others showed that a higher FoS does not necessarily mean a lower probability of slope failure. Silva et al (2008) provided a guide for estimation of the probability of failure of existing dams depending on the quality (“Category”) based on a historical database of investigations, testing, design and construction from “real world projects” as shown in Figure 101. To paraphrase Silva. et. al. (2008); Category I facilities are those designed, built and operated with state-of-the practice engineering, Category II facilities are those designed, built and operated with standard engineering practice, Category III facilities are those without site-specific design and sub-standard construction or operation, and Category IV facilities are those with little or no engineering.”
“As outlined earlier, the minimum FoS principle was introduced in dam engineering well before FE modelling became readily available, and therefore was primarily applicable for well-established LE analyses. As a result, similar minimum FoS values have been applied over almost 50 years despite the development of new analytical approaches and advances in soil behaviour understanding.
This section illustrates, using a simplified example, the quantifiable uncertainties associated with estimation of soil properties required for two-dimensional LE modelling, and the impact of these uncertainties on the calculated FoS. Other uncertainties involved in an embankment slope stability are also discussed. Undrained shear strength The undrained shear strength (Su) of cohesive soils is commonly determined from Cone Penetrometer Tests (CPTs) based on the bearing capacity theory proposed by Terzaghi (1943), and presented in Robertson & Cabal (2015) as follows: Su = (qt – svo) / Nkt ……………………….(Equation 1) where qt = cone resistance, svo = total vertical stress and Nkt = correlation factor. The cone resistance (qt) is directly measured by the CPT probe and Fell et. al. (2014) estimated that CPT readings can have errors of 5% to 15%. These errors are likely to be “unbiased” or “averaged-out” over depth. Therefore, for the purposes of estimating the average strength over a depth profile, the errors in qt may be disregarded. However, such deviations will significantly affect the lower or upper bound estimation
“The published correlations are considered too variable for the CPT to be used alone for undrained strength assessment in slope stability, other than for preliminary design with an appropriately selected FoS. In practice, the CPT should only be used for assessment of undrained strength in slope stability assessments in clay when it has been calibrated on site with good quality laboratory testing of undrained strengths (Fell et. al. 2015).
“The example presented in this paper shows that for the selected quantifiable uncertainties of ±20% in the input data, a combined variability not more than 25% in the resultant FoS could result using a conventional LE effective stress analysis. Therefore, adopting the minimum of FoS of 1.5 would reasonably account for the uncertainty in the input data. In addition, a conservative lower bound, and lower percentile values (10, 25 or 30th percentile), are taken for the input variables, without clear guidance from the industry. The additional conservatism only increases the actual FoS further and thus increases the reliability of the structure. In many cases, the simplified 2D assessment also underestimates the overall stability of the dam as it ignores the 3D redistribution of stresses. It is not clear whether the recommended minimum FoS are applicable for 2D and 3D assessments since there is limited commentary on the FoS for 3D assessments in ANCOLD or other guidelines.
The recent tailings dam failures at Mt. Polley, Canada (2014) and the Fundão Dam, Samarco, Brazil (2015) are examples where the actual failure mechanisms were not considered in the design at Mt Polley (Morgenstern et al, 2015), or certain materials were misidentified at Samarco (Morgenstern et al, 2016). In these cases, the calculated FoS for the considered failure mechanisms did not successfully account for unknowns, nor provide sufficient reliability in the design.
The FoS based design used in structural engineering, also referred to as permissible stress principle (AS1170.1:1981), was replaced by a limit state method in 1989 (AS1170.0:1989, revised in 2002). The limit state design method was introduced earlier in other countries and, for example, the first UK ‘limit state’ code appeared in 1972.
There is no means of quantitatively measuring the “real” FoS of a particular slope at a given time. Therefore, FoS of a slope is estimated based on industry standard analytical methods with assumed material parameters inferred from various data sources (laboratory, drilling, empirical correlations) under various loading conditions (e.g. static, post-earthquake, construction).
“FoS is used by designers, dam owners and regulators to quantify dam safety, but it is not directly correlated to the risk (i.e. the likelihood and consequence) of failure. For example, a dam with a FoS of 1.4 does not necessarily have a higher probability of failure than a dam with a FoS of 1.6. In their presentation at the Australian National Committee on Large Dams (ANCOLD) 2017 conference, Herza et al. agreed that FoS and probability of failure have a weak correlation:
“Interestingly, the minimum recommended factors of safety used today do not take into account the potential consequences of dam failure or the uncertainties in input values, and are based on the loading conditions only. Yet, several authors have demonstrated that a higher factor of safety does not necessarily result in a lower probability of failure, as the analysis also depends on the quality of investigations, testing, design and construction.”
2010 AND 2013 CONSIDERATION OF STATIC LIQUEFACTION POTENTIAL AT DAM1
PRE 2010 Stability Analysis And Critical Data Points
It is a good fortune of history that Washington Pirete, a geotechnical engineer for Vale, elected to do his master’s thesis on static liquefaction using Córrego do Feijão Dam I as his case study (Pirete 2010). Pirete and his thesis advisor, Romero César Gomes, later published a journal article (Pirete and Gomes, 2013) expanding the concepts of the thesis and again including Córrego do Feijão Dam I as the case study.
These two studies along with two major confidential reports by TUV SUD (2017) (2018) for Vale, preseted below, give us a window into critical measurements of Dam I over time and a sense , if not a complete overview, of what assessments were made of its susceptibility to static liquefaction..
In the introduction to both the thesis and the later journal article, susceptibility to liquefaction is acknowledged by conventional measurements and indicators. Gomes /Pirete were presenting a “Liquefaction Trigger” developed through back analysis of 33 liquefaction events. The search for a measurable trigger pre failure is part of the search for a means of being able to assess risk pre-failure, hopefully in time for correction and intervention. In application of their trigger to 2010 data ( as previously measured by Pirete) they found there was adequate resistance to collapse by static liquefaction for a water table up to “the intermediate dykes”. The toe of the 1998 raise , was at 49′ and the height of the dam was 81 ft. That finding is not inconsistent with the Rodriguez charts and summary presented above.. TUV SUD, Vale’s consulting engineer, essentially reaffirmed the Pirete /Gomes Pirete finding of non susceptibility to liquefaction up to this limit also using “Vale’s procedure”, possibly the Gomes Pirete model, and confirmed in documents seized by Minas Gerais to also be based on Osborne (2001) .
Important to note, however, ( see graph above Silva et.al 2008) that these measurements and analytic techniques do not take account of the quality of engineering and management of the dam. On the Silva et. al. Dam Category scale one might put the Brumadinho, at a III (Category III facilities are those without site-specific design and sub-standard construction or operation) and so , although we do not attach any significance to Silva’s probabilities, we do accept the premise of the paper that in considering “risk of failure”, a water table consistent with a 1.5 factor of safety could nevertheless present a very high actual risk of failure by static liquefaction.
As Silva et. al further explain”
“As outlined earlier, the minimum FoS principle was introduced in dam engineering well before FE modelling became readily available, and therefore was primarily applicable for well-established LE analyses. As a result, similar minimum FoS values have been applied over almost 50 years despite the development of new analytical approaches and advances in soil behaviour understanding. This section illustrates, using a simplified example, the quantifiable uncertainties associated with estimation of soil properties required for two-dimensional LE modelling, and the impact of these uncertainties on the calculated FoS. “
The Pirete/ Pirete Gomes, Vale TUV SUD model is a two dimensional LE model.
Brazilian Law is silent on whether LE or FE should be used and did not make note of ANCOLD’s 1969 refinements to reduce the variable of FS measurements. standards are based on regulation by minimum Factor of Safety.
” ANCOLD (1969) provided the minimum FoS only when determined from the Swedish Slip Circle or Wedge analyses and with reasonably conservative strength parameters “
Pirete/Pirete Gomes and TUV SUD all seem consitent with this ANCOLD 1969.
We present both the 2017 and 2018 TUV SUD reports for Vale. According to documents released via the government of MInas Gerais, the same procedure was used under the direction of Vale’s in house team of geotechnical consultants for all static liquefaction assessments since 2013 and was continued over the strident objections of an independent panel of experts retained by Vale. ( )
IMPORTANCE OF OVERALL DAM CONDITION AND CONDITION OF TAILINGS IN ASSESSING STABILITY
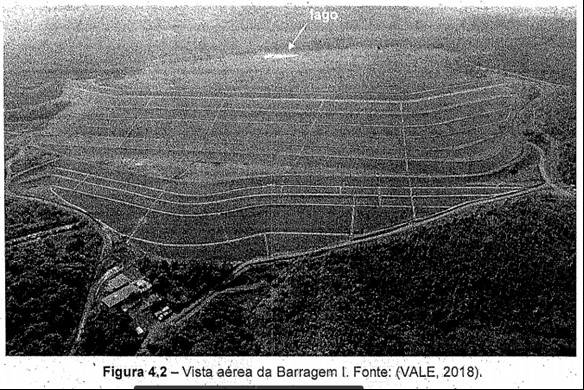
The importance of a complete consideration of actual condition of tailings materials and dam condition in assessing stability and assessing degree of risk is underscore d by the aerial images of Dam1 over 6 years prior to failure.
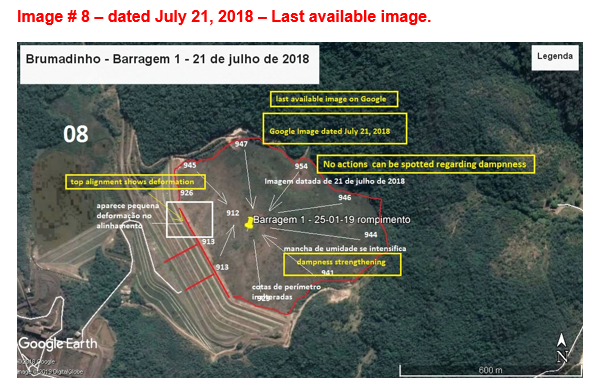
Google Earth images over a period of six years by Frederico Lopes Freire, show increasing saturation from constant natural drainage, which was not being diverted or captured, and which flowed into and over the TSF. Saturation is a main factor in liquefaction with 80% identified by our own expert , Roberto Rodriguez Pacheco as the critical level. Of course observed surface ponding is not the same as overall measurements of saturation. Freire notes a deformation in the upper left face of the dam where, in our view, the collapse initiated, based on hundreds of loops of our banner. The first indication is a large cloud of black dust right behind this deformation. Three small areas of black dust appeared in the lower right immediately after this first appearance of dust in the upper left.
The image below is the exact moment that the first crack appeared in the upper left of the top layer of the dam. This is the area where Freire’s interpretation of the Google Earth images shows increasing water inflow and overall surface saturation. Simultaneously, a large circular area in the front of the lower dam cracks. This area is also emphasized in Freire’s analysis of his Google Earth images, which shows collapse of the main drain leading from the center top to the foot of the original starter dam. For the pre-failure period, Freire’s images show erosion all the way down the face. A 2017 periodic safety review shows massive erosion at and above the toe of the starter dam. In their 2017 analysis TUV SUD states that the stability of the whole is dependent on the lower earlier sections of the dam which were also shown to have significantly lower factor of safety compared to the upper portions.
The July 11, 2011, image below is the first in the series presented in Freire’s analysis of increasing saturation.
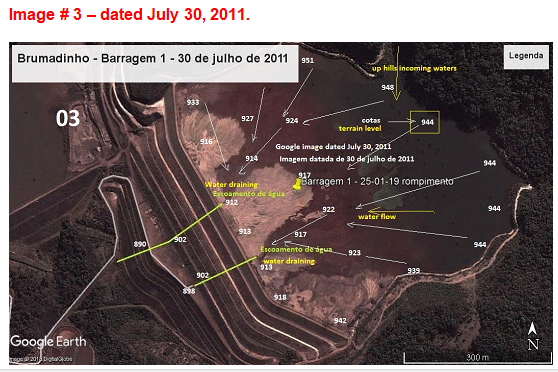
“Drainage of superficial waters originating from rain or other sources is collected at two locations as indicated at elevations 912 m and 913 m. The flux and direction are shown by the arrows. At the top of the image, at elevation 948 m, there is a clearly visible water intrusion, possibly originating from the higher elevation points located behind the dam, possibly a brook. The dense forest extending back from the dam is possibly another source of drainage into the dam.” – Frederico Lopes Freire
July 2018 is just before the date of the TÜV SÜD stability analysis, presented below, which makes no note of the deformation, but does emphasize the drainage problems within the dam. The TÜV SÜD audit , submitted to the government with a certification of stability, seems to support the Freire’s analysis in the details noted. Certainly it emphasized drainage issues.
The Freire images and analysis are an important backdrop to the Pirete Gomes work and the two TUV SUD analyses and their consideration of static liquefaction susceptibility immediately pre failure and several years after the Pirete Gomes work.
IMPORTANT TO NOTE THE TWO LIQUEFACTION TRIGGER STUDIES DO NOT HAVE THE SAME WEIGHT AS THE THE TUV SUD STUDIES AS THEY WERE NOT OFFICIAL PROJECT DOCUMENTS.
In presenting the two related liquefaction trigger studies Dam I is a case study. it is important to recognize that the purpose of these studies was to provide data to test a new methodology for evaluation of a trigger level for static liquefaction, and not to evaluate Dam I, per se. WMTF uses all such studies in our failure narratives where the data are authenticated and valid, and has a bearing on a historical description of the dam or documentation of facts associated with failure.
Both works are presumed good faith contributions to the search for a workable static liquefaction trigger, so that future failures could be assessed reliably for liquefaction potential. This kind of work is essential to eventually being able to better assess dam stability and prevent future losses. The finding that static liquefaction of Dam I was unlikely up to specified water table limits, per their specific triggers, is not the same as a finding that, in fact, that there was no potential for static liquefaction. It will require a large body of work by many to finally evolve a tool we can rely on and use. Andy Fourie, one of the world’s leading authorities on static liquefaction, is still searching for that holy grail of a critical threshold and he too is using case studies (see www.tailliq.com).
Further & most importantly Scott Olson of Olson (2001) and Olson et. al (2003), primary framer of the ‘Olson Method” has himeslf opined on the Pirete 2010) and the Gomes/Pirete( 2013)
” Although Relators assert arguments calling into question the reliability of the Olson and Stark (2003) method (referred to as the “Olson Method”) of analyzing dam stability due to the failure of the Brumadinho dam in Brazil, Dr. Olson himself disagrees with the fundamental underpinnings of those arguments. Relators claim that Pirete and Gomes used the Olson Method to assess the dam in Brazil.69 But Pirete and Gomes incorrectly interpreted and misused the Olson Method. 70 What is more, Dr. Olson did not review or comment on the Pirete and Gomes (2013) paper before it was published. 71 Correctly applying the Olson Method should have calculated a critical failure surface at the dam in Brazil consistent with the failure observed on January 25, 2019. 72 ” (Denial of Petition to Reverse Approval of Polymet Tailings Dam Permit)
PIRETE BEACH & DRAINAGE RECOMMENDATIONS TO IMPROVE DAM CONDITION AND REDUCE LIQUEFACTION POTENTIAL MADE TO AND ADOPTED BY VALE BUT NOT MAINTAINED AFTER 2013
PIRETE 2010 MASTERS THESIS
As it happened, Pirete, the Master’s candidate on the thesis and the first author of the published paper, was and is an employee of Vale. The recommendations he made in the thesis to prevent saturation that might set up liquefaction conditions and to re establish and strengthen the impaired beach were apparently adopted by Vale at Dam I and, as of 2013, when the the journal version of his thesis was published, these water management issues were in place and working. A key element of these recommendations was the maintenance of a 100 m buffer between the crest of the dam and and the pond, illustrated above. Both the Freire google earths and the two
TÜV SÜD reports presented show very clearly that these risk reducing measures were not maintained.
We respect and value these two works. However, we also share the reservations others have expressed that the data presented by Pirete (2010) and Pirete and Gomes (2013) support their conclusion that the dam was strong enough to withstand a massive sudden liquefaction up to the level of the intermediate dykes or their finding that the probability of liquefaction was very low. Publication or conference presentation of a peer reviewed paper only bring sit into professional consideration and discourse. It does not become part of “Best Knowledge” or “Best Practice” until it is thus established through many citations and widespread confirmation. Neither the thesis nor the journal paper had that status.
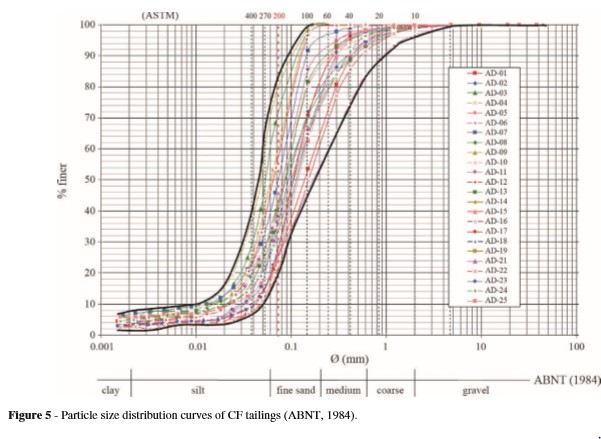
The particle size distribution above of the Dam1 i is in both the Pirete Thesis and the Pirete Gomes journal version and in both it is recognized to indicate a likely susceptibility to static liquefaction. This interpretation is confirmed by our own static liquefaction expert Roberto Rodriguez Pacheco . As Dr. Rodriguez Pacheco points out this pattern is almost the signature of some 19 cases of static liquefaction that he has documented.
Dr. Olson’s own statements that Pirete Thesis and its later ratification by Gomes Pirete misapplied “The OlsonMethod” resulted in wrong conclusions of low susceptibility by static liquefaction and that a correct application would have exactly predicted the January 25,2019 failure is an authoritative and final opinion on the matter.
This post was prepared by Lindsay Newland Bowker on February 14, 2019 and Revised April 25,2019 in consultation with our in-house experts and others, but is not yet fully peer-reviewed. We welcome any corrections or additions and any documents or records on factor of safety, saturation and the reported leaks.
Download PIRETE2010 Thesis Original Portuguese
Download PIRETE2010 Thesis ENGLISH Translation
PIRETE GOMES 2013 PUBLISHED ARTICLE IN PEER-REVIEWED JOURNAL BASED ON PIRETE THESIS
Three years after the thesis was completed, a portion of it was used as a case study in a journal article by Pirete and Gome , which restated the conclusion of Pirete’s thesis that the dam, per their critical threshold calculation, was not vulnerable to static liquefaction. “Tailings dams constructed using the upstream method generally have relatively low-density materials with a high degree of saturation. Such conditions can generate the phenomena of liquefaction, which is potentially critical in slurry tailings disposal systems. In this paper, this approach was applied for stability assessments to verify liquefaction potential in an upstream tailings dam built by the hydraulic fill technique and located in the Quadrilátero Ferrífero (Iron Quadrangle) region, southeastern Brazil. The results ratified the safety condition of the impoundment although they have demonstrated that the tailings tend to exhibit contractile behavior during shear, indicating liquefaction susceptibility.”
“The author collected thirty-three case histories of liquefaction flow failures that were back-analyzed to evaluate the yield and liquefied shear strength. Relationships between yield strength ratio and corrected SPT and CPT resistance were developed for use in liquefaction triggering analyses and also, those between liquefied strength ratio and corrected SPT and CPT resistance were developed for use in post-triggering stability analyses.”
The part of the paper addressing Dam I as the case study starts at page 51 . The conclusions are quoted below
“This liquefaction analysis procedure was applied to a Dam I from ‘Córrego do Feijão’ mine, an 81 m high ore tailings disposal system (CF tailings), located in the Quadrilátero Ferrífero (Iron Quadrangle) region / Brazil, resulting in the following conclusions:
• CF tailings tend to exhibit contractile behavior during shear and then these materials are susceptible to liquefaction;
• The referenced subdivided section of the downstream slope of Dam I resulted in nine layers being susceptible to liquefaction with resistances given by the mean values obtained from both SPT or CPT profile zones
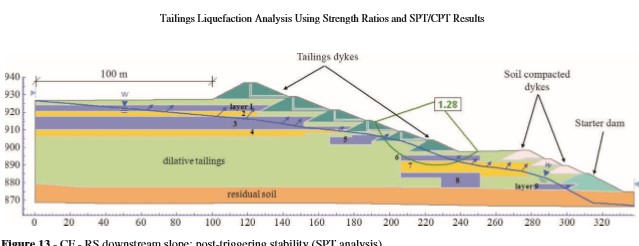
• From the specific critical failure surfaces along the downstream slope of Dam I (obtained from SPT or CPT corrected values and subdivided into 16 segments), was obtained an average static shear stress ratio value…equal to 0.207 through the critical domain of tailings susceptible to liquefaction;
• In the hypothesis of only static loading, the (FS) triggering values varied between 1.14 and 1.36, indicating that CFSR tailings are unlikely to liquefy;
• Considering a rapid rise of the phreatic line through the tailings deposit reaching the toes of the intermediate rising dykes, with complete saturation of tailings layers susceptible to liquefied, a post-triggering analysis indicated that the flow failure susceptibility of the Dam I is low even under a such critical loading event;
• The conclusions of these analyses, in addition to laboratory testing program results and based on rigid management procedures adopted in field, demonstrate that Dam I constitutes a safety structure against mechanisms from liquefaction-induced failures;
• Although the Olson (2001) and Olson & Stark (2003b) liquefaction analysis has been proposed mainly for cohesionless* soils, the methodology is consistent and suitable for preliminary analyses of liquefaction potential in tailings deposits (generally relatively low-density materials with a high degree of saturation), particularly upstream tailings dams.”
*
Cohesionless soils are defined as any free-running type of soil, such as sand or gravel, whose strength depends on friction between particles (measured by the friction angle, Ø). As you can see in the particle chart above, Dam 1 soils are not “cohesionless”, as Pirete and Gomes readily acknowledge Additionally sinter tailings , the kind of tailing s in Dam 1, have unique characteristics and properties that actually increase their susceptibility to all types of failure including by static liquefaction..
Vale has not commented specifically on how either the thesis or its further examination in Pirete and Gomes (2013) was relied on, but public statements suggest it was the official method required by Vale. The method which Vale requires all engineers use in stability analysis,per documents only recently available through Minas Gerais, is also based on Olson (2001), the cohesionless soils model and was described as continuously in effect from 2013.
DOWNLOAD GOMES PIRETE 2013 JOURNAL ARTICLE
This post is the sole work and responsibility of Lindsay Newland Bowker, Executive Director, World Mine Tailings Failures, based on input from WMTF experts It is posted inviting and pending their peer review and review by other experts, including WMTF Chief Compiler, Engineering, Dr. Roberto Rodríguez Pacheco, and colleague Dr. Andy Fourie, two of the top people in the world on static liquefaction. It is WMTF policy that all posts be peer-reviewed and be noted as pending peer review where that has not occurred. Lindsay Newland Bowker, Stonington, Maine, February 13, 2019, Revised 3/13/2019)
TÜV SÜD RECOMMENDATIONS
.
TÜV SÜD, taking over from Tractebel and succeeding a long line of consulting engineers, provided two in-depth stability analyses on Dam 1. The first in 2017 provided a long in-depth geotechnical history of the dam and included many new original data points. The 2018 report is far less comprehensive, includes no new data points but addresses the status of the 2017 findings and recommendations.
Statutory Context & Purpose Of Reports
Both are reports are of a type specifically mandated by Brazil’s Dam Safety ACT (2010) which sets forth reporting requirements for all tailings dams . The National Standards for TSF’s as first set forth in 1993 and as most recently revised 2017 with no significant change in those sections governs the process and standards for cerification of stability and the triggering of timely actions were problems are found to exist.
This TÜV SÜD 2017 report is a “Dam Safety Perioidc Review of Dam Safety (RPSB)” aimed at diagnosing the general state of dam safety, considering the current state Art for the design criteria, the update of hydrological data, changes in the conditions upstream and downstream of the project and indicate the actions to be taken by the owner/operator for the maintenance of security. It was not prompted by any concern, alert, or perception of high risk on the part of government. It’s contents and form are largely determined by the regulation itself and facilitates oversight through specification of form and contents. The mandated format for classification for Risk is entirely by a Government process which when applied to Dam 1 resulted in a low risk classification.
“Where the conclusions of RPSB indicate non stability of the structure, this information should be transmitted to the DNPM[ now ANM] immediately through SIGBM system, which will result in immediate interdiction of the suspension structure and at the entrepreneur, the discharge of effluents and / or waste in the reservoir”
This action had already been taken in 2016 but it was apparently not in response to a finding of non stability as records show the stability was confrimed in 2016. The dam was since then under a program to de water it with a view to being able to undertake a long planned re mining project under which the entire TSF would have been removed from the site over a period of 19 years In the Spring of 2018 the re mining project received expedited government approval. TUV SUD was to be in chrage of the re mining and a context of these two reports is in part preparing Dam 1 for the initiation of those operations..
We offer download of the complete 2017 report in English, original portuguese and Spanish but here include only those sections on the presentation of factors of safety and stability analysis. Both reports calculate both drained and undrained factor of safety and both address static liquefaction risk which they indicate is per the methods Vale employs and required them to employ in evaluating that risk. We offer our notes in English and the full 2018 report in original Portuguese for download.
DAM HISTORY & STANDARDS OF PRACTICE CONTEXT
It is important to frame the two works in the context of long established standards of practice for stability analysis which any engineer should apply in accordance with good practice regardless of whether law specifies a different and lower standard and no engineer should agree to perform a stability analysis under assumptions or methods that are in violation of these known best practices.
TUV SUD was asked to provide a stability analysis for an upstream dam already inconsistent in its design with two key safety factors for upstream dam design: it’s height and its slope. It had 87 m of essentially contractant materials. (sinter tailings) which by their nature elevate failure risk. Regardless of the specifics of law & regulation or contractual requirements an engineer undertaking a stability analyisis of an upstream dam must by good engineering practice take specific account of all the conditions known to affect stability.
As noted above in the introduction to static liquefaction this rarely happens in practice in law regulation or in the provision of engineering services on stability analysis of upstream tailings dam. The norm is the exception to known best practice. Nevertheless, there is one overriding enduring very basic rule: Best practice for decades has been to use the lower bound undrained strength in analyses IF the material could fail in such a manner (e.g. liquefy for cohesionless materials) and IF the material was providing any support to the containment of materials. Both were true at Dam 1. Therefore, the appropriate method by which to determine the best factor of safety for the Dam was an undrained stability analysis, USA-SS as it’s actual shear strength was in that range ( and remained there at .09 in the TUV SUD 2018).
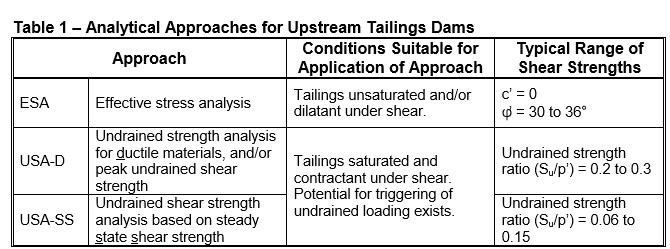
A considerable difference exists between undrained shear strength under peak vs. residual conditions. How these different modalities treat the dynamics of failure is illustrated in the figure below. In both analyses TUV SUD presented USA-D ( peak strength) even though the undrained strength ratio was known to be <0.15, the standard for a USA-D. The difference is in the loading condition an increased shear stress( eg from a specific loading event ) vs a constantly present loading condition.
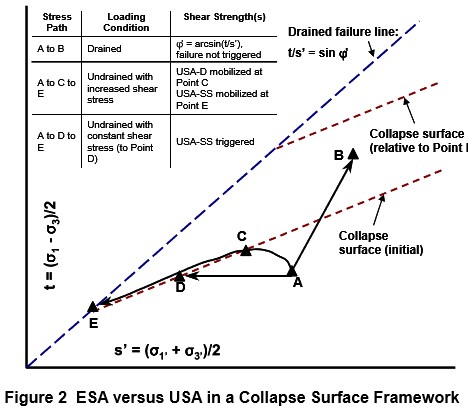
“The choice of the appropriate strength depends on the nature of the undrained triggering mechanism under consideration. For undrained failure under static loading as illustrated by stress path A-C-D, the USA-D strength could be used, as this strength must be mobilized first before collapse to the USA-SS strength occurs. However, other triggering mechanisms will result in a different stress path that does not mobilize the USA-D strength, such as stress path A-D-E. This type of stress path can occur under cyclic loading, where the shear stress (t) remains constant, but repetitive contractant loadings lead to increased pore pressures and decreased effective stress (s’), until the collapse surface is engaged at a shear strength less than the USA-D strength represented by Point C. This same stress path can also occur under static loading conditions due to increased pore pressures within the tailings dam, which might for example be caused by reduced efficiency of an under-drainage system and resultant rise in the phreatic surface. Under this stress path, drained conditions can exist up to the moment that the collapse surface is engaged and liquefaction occurs.” Martin,McRoberts,Davies “A Tale of Four Upstream Dams”
By the Martin McRoberts Davies rule, USA SS was the appropriate method for this analysis regardless of law regulation or contract. Law required in this case that a factor of safety 1.5 applies regardless of the method used. The undrained (USAD) using Slide 7, a popular LE model for calculating factors of Safety were all well below 1.5.
Specifics of Law on Stabiliy Analysis
NBR13028 5.4.4.10.1 sets forth the procedures and standards for stability analysis .
“The minimum safety factor values to be determined by the deterministic stability analyzes should consider the loading conditions, drained or undrained, of each of the materials involved.
“For undrained loading conditions, the stability analysis can be performed on total stresses, using resistance parameters undrained or effective stress, with the use of actual and estimated parameters poropressões resistance. For drained loading conditions, stability analyzes should be carried out in effective stress, with the use of actual parameters of shear and poropressões estimated by percolating network. peak strength parameters or residual can be used for different situations encountered, justified project. The minimum safety factors according to Table 1 should be obtained irrespective of the type of analysis and charging conditions:
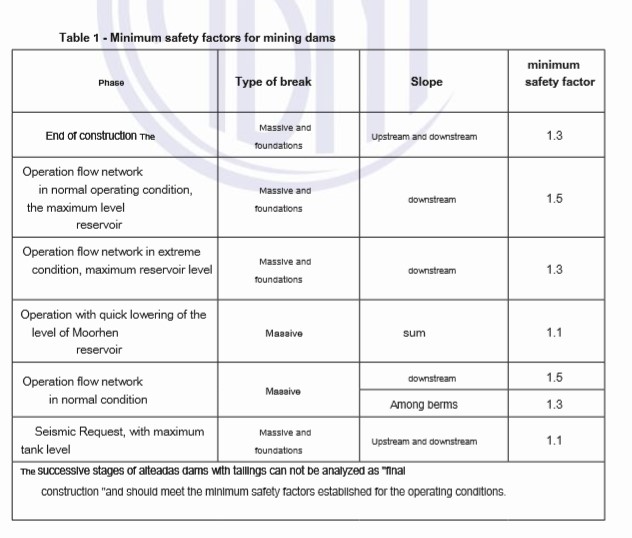
While NBR 13028, The Standards law seems to be seeking a factor of safety per the best method appropriate to actual conditions, the reporting provisons of law , The Dam Safety Act, while not contradicting, modifying or confounding the interpretation of the standards provision does seem to ask for runs and discussion on both drained and undrained. The governing would seem to be Standards provisions and that would seem to expect that in the Dam Safety provisions after running both the engineer would discuss which is applicable and framed the final finding of stability on that basis. This is not, however, specifically reconciled as between the two applicable. parts of law.
It is not clear whether TUV SUD Brazil has its own attorney and made its own specific ic findings as to duties under both laws ( Dam Safety & Dam Standards) or whether it relied on Vale and possibly its attorneys.
In a post failure statement at its website dated February TuV SUD cites flaws in the legal framework as an adequate basis for exmaining stability and refused to certify and further dams under this process.
TÜV SÜD AG (TÜV SÜD) welcomes the Brazilian government’s decisions on 18 February 2019 to reinforce safety in upstream tailing dams and / or to decommission these dams at the latest by 2021. We support the decision that safety standards must be increased and implemented in this transitory time. We believe that this is of paramount importance. However, there is heightened uncertainty as to whether the current system of DCEs (Declaração de Condição de Estabilidade da Barragem) provides a reliable declaration of the status of stability of the dams and can still be considered as appropriate to adequately protect against serious risks, in particular for human life and the environment caused by tailing dams. Considering these safety concerns, TÜV SÜD Bureau de Projectos e Consultoria LTDA has informed Vale that it is not in a position to issue any future DCE’s and reports until a thorough review of the system is completed. TÜV SÜD is offering its full cooperation and expertise to authorities and institutions.
With the support of its own and external experts, TÜV SÜD is investigating internal processes thoroughly, as well as potential root causes for the tragic dam collapse in Brumadinho. It would be absolutely unacceptable for TÜV SÜD if declarations were signed against better judgement. This would go against all the company’s rules and its philosophy.
TÜV SÜD AG (TÜV SÜD) welcomes the Brazilian government’s decisions on 18 February 2019 to reinforce safety in upstream tailing dams and / or to decommission these dams at the latest by 2021. We support the decision that safety standards must be increased and implemented in this transitory time. We believe that this is of paramount importance. However, there is heightened uncertainty as to whether the current system of DCEs (Declaração de Condição de Estabilidade da Barragem) provides a reliable declaration of the status of stability of the dams and can still be considered as appropriate to adequately protect against serious risks, in particular for human life and the environment caused by tailing dams. Considering these safety concerns, TÜV SÜD Bureau de Projectos e Consultoria LTDA has informed Vale that it is not in a position to issue any future DCE’s and reports until a thorough review of the system is completed. TÜV SÜD is offering its full cooperation and expertise to authorities and institutions. With the support of its own and external experts, TÜV SÜD is investigating internal processes thoroughly, as well as potential root causes for the tragic dam collapse in Brumadinho. It would be absolutely unacceptable for TÜV SÜD if declarations were signed against better judgement. This would go against all the company’s rules and its philosophy
Again, it is not clear whether TUV SUD Brazil had ts own attorneys review the law before agreeing to use Vale’s consistently applied system. We find the fault not in the text itself but in the absence of adequately trained regulatory personnel to independently review and certify filings by contractors independent consultants. We read the law and standrds as very clear.
2017 TUV SUD STABILITY ANALYSIS
At the very end of well over two hundred pages this very complex report finally addresses the inadequacy of Vale’s required geotechnical method of stability analysis for liquefaction risk. It argues, in line with the best- informed current thinking, Morgenstern 2018), Davies et. al. (2002) , Herza et al. (2017), Silva et,al. (2008), Smith(2003) et.al.(2017), Klohn Crippen Berger(2018) that the method employed by Vale, while most prevalently in use throughout the world, leaves the greatest uncertainty and variability as to actual stability conditions as compared with other methods now available. It is unambiguously clear that their focus is on the actual condition of Dam 1, its extreme vulnerability to any triggers, even the vibration of truck, and the imperative of improving drainage and reducing the water level in the dam. They strongly caution the trigger risks of even installing the horizontal drains in the lower portions on which the whole safety of the dam depends; of initiation of any re mining or rearranging or removal of soils, of any vibrations or use of explosives anywhere near the dam until a higher level of certainty concerning stability is attained.
Their conclusion in essence said the Government process and Vales own in house method of measuring stability do not actually measure risk (do not correlate with likelihood of failure) and include a plethora of critical uncertainties. They advise a very strict and very cautiously implemented effort to keep de risking the dam through improved drainage, if possible, to get the water table as low as possible. They report some indications of progress in lowering the water level from instruments (piezometers).
FACTOR OF SAFETY DRAINED CONDITIONS ASSUMPTION
All factor of safety calculations are only meaningful indicators of actual failure risk to the extent that they take full account of the actual conditions in the dam. A drained assumption is meaningless if the condition in the dam is actually undrained, i.e. there is a water table within the dam. The 2017 report makes it very clear there were critical and concerning water levels in the dam.
TÜV SÜD calculated factors of safety in excess the Federal requirement of 1.5
“Stability analyzes under drained conditions were performed and Safety Factors obtained were FS = 1.93 (Section 2-2), FS = 1.76 (Section 3-3) and FS = 1.60 (Section 4-4), … the critical surfaces of rupture which affect entire structure extend below elevation 899 ( the toe of the 4th raise )indicating that the lower third of the downstream slope is what determines the stability of the Dam I under drained conditions.”
“It is concluded that the Dam I is stable for the scenario of destabilization of the slope of downstream under a drained condition. The safety factors obtained comply with the NBR-13028 (2017), which recommends a minimum safety factor of more than 1.50 for the operation.”
In other words,they perhaps are saying to Vale and To DNPM ( now ANM) in accordance with the specfic requirements of the Dam Safety Act to consider both drained and undrained , if an undrained condition were present or could be attained. But that is easy enough to say plainly .
They emphasized that under an assumption or state of drained conditions the stability of the entire dam depended on the stability of the lower third of the dam (those portions built prior to 1984) which had been designed by Erb and managed and raised by Technosan. A failure in the lower 3rd (below 889) would trigger a complete failure. Those layers, the starter dyke and very first raises, were identified by Technosolo, designer of the 4th to 8th rises, as having a factor of safety below 1.3 and severe drainage problems including upwellings noted at the toe of the dam at el 875.

“ In the development of the 4th upgrade project, it was verified that the safety factor of the structure did not comply with that recommended by the technical standard, less than 1,3. upwellings in the region of the initial mass near El. 875,0m.were also apparent.” Doc.[28].”
STABILITY UNDER ASSUMPTION OF UNDRAINED CONDITIONS
The actual condition of the dam in 2017 was very clearly and without question an undrained condition. Per the Martin et. al guidance presented above both a USA-D ( peak stress) and a USA-SS( residual stress) were indicated with the lower taken as Factor of Safety. The USA-SS was not presented even though the strneth ratio ( .09 on 2017) indicated residual stress should be performed.
TÜV SÜD instead explains that they were required to use Vale’s method as had been directed by Vale and done by prior engineers for stability analyses in 2013,2014,2015 and 2016. It is not clear whether that calls for peak strength only or how otherwise “the Vale Method” is specfically reflected in the choices TUV SUD made in this report.
“Stability analysis under non-drained conditions aims to evaluate vulnerability to a dam rupture by liquefaction. The susceptibility of the materials to the liquefaction was presented and it was conservatively considered for Dam I that all saturated wastes are susceptible. The geotechnical parameters considered the non-drained resistances for materials susceptible to liquefaction and assumed maintenance of effective resistances for the other materials, according to the methodology that has been used by Vale based on Olson (2001).”
SLIP 7,the specific model used for determining the critical surface is an “Olson Method ” base LE ( Limit Equilibrium) model.
We have not seen in the literature any specific discussion of the conditions under which an engineer should agree to use the stability analysis protocol of the dam owner/operator. Per the basics of due diligence, however, if the engineer agrees it is suitable to the materials and conditions of the dam, there are no issues in using the owners established stability analysis protocol.
All of the undrained factors of safety per the peak stress assumpation (USA-D) were below 1.3.
“Thus, the stability analyses performed considering an unknown trigger, resulted in Safety Factors FS = 1.22 (Section 2-2), FS = 1.18 (Section 3-3), and FS = 1.09 (Section 4-4).”
Per McRoberts et. al , above, Best Practice was to also consider residual stress given the nature of the materials and the known water level conditions within the dam. Undrained Stability (USA-SS, in the table above) much lower factor of safety results would have been obtained better actual decsriptions of the critical state of the dam in 2017.
In their consideration of factor of safety under undrained conditions TÜV SÜD confirms susceptibility of most materials to liquefaction but their analysis focuses on the probability of a trigger. Essentially they are asserting that susceptibility to liquefaction is not the same as likelihood of failure by static liquefaction but rather express only a vulnerability to any trigger and that in the absence of such a trigger these low factors of safety for an undrained condition do not constitute a risk of failure per se.
“In order for the phenomenon of liquefaction to occur, in addition to the presence of susceptibility, there needs to be a trigger. Triggers can be associated with static or dynamic events, such as: excessive pore pressures due to rapid loading (rapid dam abatement, elevation of the reservoir level, etc.), earthquake or induced vibrations (natural earthquakes, equipment, detonations, ruptures of adjacent structures, etc.), which increase shear stress or impose shear deformations (removal of material from the foot of the dam, movement of the foundation, etc.), among others”
“From the inspections carried out, monitoring data and analysis of project, the Dam Safety Inspection Reports of the 2013, 2014, 2015, 2016, 2017 and 2018 found that the structure was in adequate safety conditions both from the point of view of the design and the physical stability of the entire structure”. P 66
It will be the work of a hopefully completely independent failure analysis panel to reconcile the undrained stability analysis conducted by TUV SUD with best practice and best knowledge and assess whether the guidance given significantly understated risk or unreasonabl overstated factor of safety given the actual condition of materials , the actual condition of the dam, and the level of the water table within the dam.
The expert panel report released December 13, 2019 did not evaluate TUV SUd’s analysis or any prior analysis. They presented the entire history of prior stabiity analysis without much comment.
They apparently interpret the Brazilian regulation in effect since 1993 and requiring a minimum factor of safety of 1.5 as not applicable to an analysis of undrained condition even though the language specifically directs a choice of method based on a consideration of actual materials measured and observed conditions
“The NBR-13028 (2017) standard does not recommend a minimum safety factor for the failure liquefaction. It is understood, however, that for this phenomenon to develop, it a trigger is required, which can be understood as an exceptional low probability event , with a safety factor of 1. ( failure)”.
The law establishes a single factor of safety ,1.5, as the required minimum and is reasonably clear that the method for arriving at that must take complete account of actual conditions, That is 1.5 applies to drained, undrained-D, Undrained-ss. Their own undrained-D factors of safety are below the given regulatory standard. . There is no ambiguity that a different standard applies to different methods of analysis even though the law does not spell it out in just those specifics.
They then consider the limitations and uncertainties of the method required by Vale, called a Limit Equilibrium (LE) model . Important to recall that this is an internal report to Vale and not a submission on Vale’s behalf to Government.
“Leshchinsky and Ambauen (2015), however, demonstrate the existence of an epistemic error to the Limit Equilibrium method, which imposes rupture surfaces and subdivides the mass into unstable in lamellae that do not account adequately for the kinematics of the liquefaction phenomenon “
T ÜV SÜD then compared the results obtained by the Limit Equilibrium method with the results of Numerical Limits, which are more rigorous for analyzing a realistic kinematics and as a result, in addition to the safety factor, also the mechanism of rupture. P 107
” .. a safety factor higher than 1.05 covers a possible error in magnitude of the FS involved in the calculation method to calculate FS”
The results of 1.18,1.22 and 1.09 all exceeded this “error tolerance” limit on Kinematic dynamics.
They concluded that despite the uncertainties in the Vale (Olson (2001)) model it is satisfactory on its own terms as a method of calculating a factor of safety on undrained conditions., i.e. close enough to actual by other empirical methods.
“On the other hand, Olson’s (2001) methodology for liquefaction analysis has uncertainties because it does not adequately represent the phenomenon of static liquefaction..However, because it is a semi-empirical method, it is safe when applied within the scenario for which it was created”
Their consideration of LE misses other critical limitations including for exmaple that LE assumes a rigid block moving when what actually occurs s a flow side..
“…limiting-equilibrium procedures wherein the material circumscribed by some assumed failure surface of circular, planar or composite geometry is assumed to slide as a rigid body. The effects of internal deformation within the sliding mass of material are neglected. While the nature of many rotational slides in natural slopes of cohesive or dense soils gives some credence to this rigid-body assumption, many if not most slides that involve hydraulically deposited tailings occur in large part as flow slides. Blight and Steffen (1979) note the occurrence of flow slides in South African gold tailings embankments, and Bishop (1973) describes several examples of flow slides in tailings embankments and mine waste piles. This mode of failure certainly violates the rigid-body assumption of limiting-equilibrium analysis. Although most tailings embankment slides (with the exception of those induced by seismic liquefaction) probably have a rotational-type slide as their trigger mechanism, it is the flow-type behavior that is so destructive, as witnessed by the failures of a mine waste pile at Aberfan, Wales (Bishop, 1973), and a coal refuse embankment at Buffalo Creek, West Virginia (Wahler, 1973) – both with major loss of life.” pp. 186-187 of Steven G. Vick, 1990. Planning, design, and analysis of tailings dams, 2nd ed. BiTech Publishers, Vancouver, BC, Canada.
In their overall conclusion they emphasize the importance of loss prevention/risk reduction through trigger avoidance and emphasize the limited confidence that should be placed on safety factors alone for a proper assessment of actual risk of failure by static liquefaction.
“It should be noted that the geotechnical parameters associated with probability of occurrence are variable. This variability makes the calculation results (FS) indeterminant as to the associated probability of rupture. The greater the uncertainty about the input data of the calculations or the greater the variability of the parameters, the greater the probability of rupture, even if the analysis with average parameters indicate satisfactory safety factors. For the case of the probability of liquefaction, it must be adjusted by reducing its value according to the probability of occurrence of the liquefaction trigger. In order to increase the safety of the dam as to the liquefaction failure mode, it is recommended to adopt measures that reduce the probability of occurrence of triggers. In this way, the induction of vibrations, the prohibition of nearby detonations, the avoidance of heavy equipment on the dam, prevent the raising of the water level in the reject, do not perform works that remove material from the feet of the slopes or works that cause reservoir or dam. “P140
They advocate against continuation of Vale’s LE Olson (2001) based method of evaluating static liquefaction risk. They argue that for the sake of safety the widespread use and acceptance of their method is not defensible justification for its continued use.
“With regard to the liquefaction failure mode, the methodology employed can be considered as the current state of practice, being the most accepted in the world technical community. However, developments are still necessary, since Equilibrium Limit do not consider the tension-deformation behavior of the tailings and it is this that controls the physical phenomenon of liquefaction””
“An improved method of determining non-drained resistance (strongly depending on the type of test and on-site soil status, which is difficult to determine) and selecting the appropriate approach to stability assessment ( analysis of effective stresses considering the actual behavior stress-strain behavior of the soil with post-peak softening of resistance, coupled with the theory of densification to predict the dissipation of excess pore pressures)”
The issue is not Olson per se but of selecting the right methods, parameters modalities and data for the stress that is being considered. Sadrekarimi (2016) for example, also builds on the Olson method by including the important effects of shear and stress anisotropy. This method is currently used by several consulting firms (including Golder, Thurber, etc.) for design and slope stability analysis of dams. It was also used by Dr. Norbert Morgenstern in his report of the Fundao Dam’s failure in 2015. However, The peak undrained strength predicted by Olsons method which was used by TUV SUD is only applicable for cases where a dam is being raised and not appropriate post construction ( eg at the Fundao and Brumadinho) per a highly qualified stability expert who has asked not to be cited by name.
So beyond the LE FE debate there is still the important territory of selecting the correct method for liquefaction analysis for the conditions,stress and loading concerns at that moment in time and having the technical capacity at hand to apply and interpret the results of those analytic methods. One model for all situations, as Vale requires does not satisfy that requirement.
At the Brumadinho overall in 2017 this was not the case.
Finally they note that the measures undertaken to reduce the water level on the dam already showed some progress and endorsed the decision to not add load through further depositions as critical to safety.
Their further remarks and recommendations emphasize the still extremely vulnerable and fragile state of the dam. Improved draining at the critical lower third of the dam from el 899 to the toe is especially highlighted (the area which in 1995 had contributed to a factor of safety rating below 1.3) and identified as determinant of stability of the entire dam.
In this screen shot it appears to be exactly across this level that the dam failed and as predicted by TÜV SÜD precipitating a break across the entire crest
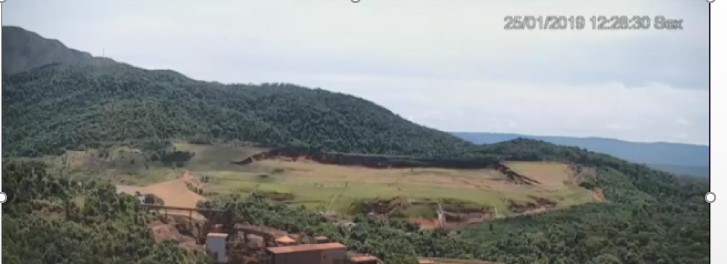
The image supports the 2017 TUV SUD analysis of vulnerabilities and critically vulnerable sections of the dam.
The urgently critical vulnerability of the dam is conveyed in their further recommendations
.” · Lowering the water table
In addition to the previous measure and in a more direct way, horizontal deep drains (DHPs), with lengths of 100 m, first line on the recoil shoulder of the El. 899 m and later a second line at the foot of the dam.
This is a delicate operation, due to the risks of soil loss during drilling and induction of excessive shear of the in-situ tailings. Vale stresses that it has done the continuous and careful monitoring of the drilling operation and installation of the tubes, and performs deformation monitoring by means of interferometric radar, described below.
It is also planned to drill lowering wells, in case of inefficiency of DHPs. The depletion of the water table aims at promoting increase in the safety of the structure by reducing the active pore pressures
(Docs. [192], [193] and [194]).
· Radar displacement monitoring
An interferometric terrestrial radar was installed in early May located near Dam I. This equipment
detects displacements in the surface in intervals of 3 minutes.This close continuous monitoring for any movement increases safety and reduces risks.(Doc. [195]).
· Remining of waste
Finally, as a definitive solution, Vale opted to remine the waste disposed in the
Dam I, effecting its complete removal. The environmental license is already in progress
in the Secretary of State for Environment and Sustainable Development of Mines
General. This is a long term solution, however. And cannot be pursued until the immediate dewatering and stabilization methods have attained their objective. (Docs. [196] and [197]).
Tractebel, reporting directly to Vale , not TÜV SÜD conducted the required Government analysis and made the submission affirming stability of the dam in accordance with the requirements of Law.
DOWNLOAD 2017 TUV SUD STABILITY ANALYSIS ORIGINAL PORTUGUESE
DOWNLOAD 2017 TUV SUD STABILITY ANALYSIS ENGLISH
DOWNLOAD 2017 TUV SUD STABILITY ANALYSIS SPANISH
This post is the sole work and responsibility of Lindsay Newland Bowker, Executive Director, World Mine Tailings Failures, based on input from WMTF experts It is posted inviting and pending their peer review and review by other experts. We would like to thank Dr. Michael Davies for the very useful paper “A Tale Of Four Upstream Dams”.
It is WMTF policy that all posts be peer-reviewed and be noted as pending peer review where that has not occurred.
The Translations are from an online translation service. We would appreciate any help smoothing them out in areas where sentence structure or actual words are not quite right.
Lindsay Newland Bowker, Stonington, Maine, March 28,2019. Most Recent Revision 5/11/2019 Please forward comments to compiler@ worldminetailingsfailures.org